Apple Vows 100% Recycled Marterials
Apple put out its 2017 Environmental Responsibility Report[PDF].
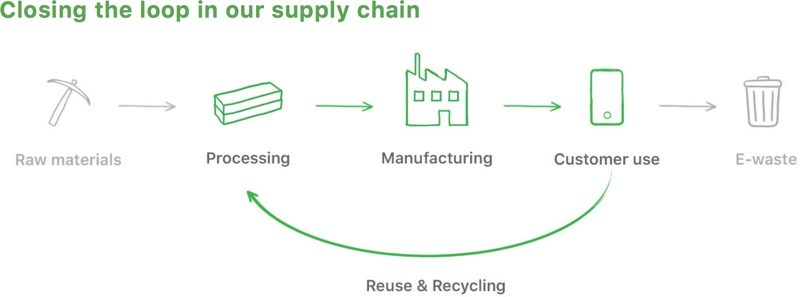
It promises to end mining and to increase its use of recycled materials to 100%!
“One day, we’d like to be able to build new products with just recycled materials, including your old products,” Apple says on its updated Environment site.
In an interview with VICE, Apple vice president of environment, policy and social initiatives Lisa Jackson commented on the mining plan, saying “it’s where technology should be going.”
Source: https://www.macrumors.com/2017/04/19/apple-recycled-materials-end-mining/
See also: http://inhabitat.com/apple-announces-goal-to-make-products-from-100-recycled-materials/
Here is the full text of the report:
Environmental Responsibility Report 2017 Progress Report, Covering Fiscal Year 2016 We are now protecting and creating enough sustainably managed forests in China and the United States to cover all of Apple’s product packaging needs. Environmental Responsibility Report | 2017 Progress Report, Covering FY2016 2 Page 3 Environmental Responsibility at Apple Page 5 Climate Change Page 16 Resources Page 28 Safer Materials Page 32 Better Together Page 36 Appendix A Apple’s Operations: Environmental Data • Facilities Environmental Key Performance Indicators • Scopes 1 and 2 Building Carbon Emissions • FY2016 Natural Gas and Electricity Use Page 41 Appendix B Data Center Energy Supplement Page 47 Appendix C Assurance and Review Statements • Corporate energy, carbon, waste and water data • Product life cycle carbon footprint • Fiber footprint Page 57 Appendix D Environmental Health and Safety Policy Statement Can we power a global business with the sun, wind, and water? Can we get 100 percent of our supply chain to move to 100 percent renewable energy? Can we one day stop mining the earth altogether? Can we use only 100 percent recycled and responsibly sourced paper in our packaging? Can we improve on the world’s best materials? That’s Apple: asking bold questions, tackling big problems, and relentlessly innovating to solve them. The approach also lies at the heart of our global environmental strategy—driving us to make not just the best products in the world, but the best products for the world. Apple’s 2017 Environmental Responsibility Report, covering fiscal year 2016, is our tenth annual update. It highlights the ambitions we have set for ourselves and our progress toward meeting them. We remain focused on three priorities through which we—and our stakeholders—believe Apple can make the biggest difference: • Reduce our impact on climate change by using renewable energy sources and driving energy efficiency in our products and facilities. • Conserve precious resources so we all can thrive. • Pioneer the use of safer materials in our products and processes. We still have a long way to go and a lot to learn. But we’re making tremendous progress. In 2016, 96 percent of the electricity used at our global facilities came from renewable energy, reducing our carbon emissions by nearly 585,000 metric tons. We’re 100 percent renewable in 24 countries—and all of Apple’s data centers. Our work is led by Lisa Jackson, Apple’s Vice President of Environment, Policy and Social Initiatives, reporting directly to CEO Tim Cook. The Office of Environment, Policy and Social Initiatives works with teams across Apple to set strategy, engage stakeholders, and communicate progress. Our integrated approach means that decisions about Apple values, including environment, are reviewed and supported at the highest levels of the company. Environmental Responsibility Report | 2017 Progress Report, Covering FY2016 3 Environmental Responsibility at Apple To ask less of the planet, we’re asking more of ourselves. Environmental Responsibility Report | 2017 Progress Report, Covering FY2016 4 Our new corporate campus, Apple Park, is on track to be the largest LEED Platinum–certified building in North America. Over 80 percent of the new campus is open space with more than 9000 drought-tolerant trees. And, of course, it’s powered by 100 percent renewable energy. We’re pushing our manufacturing partners to join us in the fight against climate change. Seven major suppliers have now pledged to power their Apple production entirely with renewable energy by the end of next year. And we’re making strides toward our commitment to bring 4 gigawatts of renewable power online by 2020, a key step in reducing our manufacturing footprint. We launched our supplier clean energy program in October 2015. But between our own clean energy projects to target emissions from upstream suppliers and those our direct suppliers have embarked on, we already have commitments for 2 gigawatts of clean energy in our supply chain. To preserve precious resources, over 99 percent of the paper in our product packaging is from recycled or responsibly managed sources. And, in only two years, through partnerships with the Conservation Fund and World Wildlife Fund, we have achieved our goal of protecting or creating enough sustainably managed working forests to cover all of our product packaging needs. That’s just a start. We’re going deeper to pioneer a closed-loop supply chain, where products are made using only renewable resources or recycled material to reduce the need to mine materials from the earth. That means continuing to invest in ways to recover materials from our products—like Liam, our line of disassembly robots—and encouraging our customers to return products through Apple Renew, our recycling program. And we’re launching projects and experiments that help us learn how to close loops. For example, we’ve melted down iPhone 6 aluminum enclosures recovered from Liam to make Mac mini computers for use in our factories, and we’re transitioning to 100 percent recycled tin solder on the main logic board of iPhone 6s. We’re also continuing our quest to make our products and processes even safer by pioneering ways to reduce and remove toxins. We again expanded our Environmental Testing Lab, where our chemists and toxicologists look for any potentially harmful substances in our products. And, through our Full Material Disclosure program, we’ve identified all the substances present in more than 20,000 individual components—up from 10,000 a year ago—so we can understand their effect on people’s health and the environment. It’s clear to us that now, more than ever, we can show the way to a better future. We’re constantly working to show what’s possible and inspire others to create a healthier environment. We’re devoted to improvement and openness, and we encourage you to join us in working to leave the world better than we found it. 96% Of the electricity that powers our global facilities, 96 percent comes from renewable sources. Environmental Responsibility Report | 2017 Progress Report, Covering FY2016 5 Climate Change How can we lead the fight against climate change? We mapped our carbon footprint, and we’re working to eliminate it. When we measure our carbon footprint, we include hundreds of suppliers, millions of customers, and hundreds of millions of devices. And we’re always looking for ways to make the biggest difference in five major areas: manufacturing, product use, facilities, transportation, and recycling. To reduce our carbon footprint, we design each generation of our products to be as energy efficient as possible. We’re sourcing lowercarbon materials to make our devices, we’re partnering with suppliers to add clean energy to their facilities, and we produce and procure clean, renewable energy for 96 percent of the electricity used at our global facilities. In 2016, our comprehensive carbon footprint was 29.5 million metric tons, compared with 38.4 million the year before. A variety of factors contributed to the 23 percent decline, including benefits of our environmental programs (such as reduced emissions from aluminum manufacturing and installing clean energy in our supply chain), a year-over-year decline in the total number of products sold, and changes to our carbon footprint calculations. Every year we refine our product life cycle analysis, moving from industry-average data to more Applespecific data whenever possible, and in 2016 we developed more detailed information about the carbon intensity of the integrated circuits we use. Without the methodology changes, our carbon footprint would have declined by 10 percent. 2011 2012 2013 2014 2015 2016 137.2 126.7 124.1 122.1 114.1 97 Carbon emissions per product (kg) We’ve decreased carbon emissions per product every year since 2011. Click here for more information on how we calculate our carbon footprint using life cycle analysis. Environmental Responsibility Report | 2017 Progress Report, Covering FY2016 6 Our comprehensive 2016 carbon footprint. 29,500,000 metric tons of greenhouse gas emissions 77% Manufacturing 17% Product Usage 4% Product Transportation 1% Corporate Facilities 1% Recycling Manufacturing Manufacturing a smaller footprint. Manufacturing makes up 77 percent of our carbon footprint. Most of it is due to carbon emissions from the electricity used to make our products—over 60 percent of our manufacturing emissions. So we’re sourcing lower-carbon materials, partnering with our suppliers around the world to reduce their current energy use, and helping them switch to renewable energy. We believe that together we can transform the manufacturing process to dramatically reduce emissions. We’re helping our suppliers switch to renewable energy. Since the electricity used to process raw materials, make parts, and assemble our products is the largest contributor to our overall carbon footprint, we’re helping our suppliers reduce the amount of energy they use. In 2015, we started engaging directly with suppliers to find ways to reduce their energy use, such as replacing outdated or inefficient heating, cooling, and lighting systems; repairing compressed air leaks; and recovering waste heat. We aim to promote continual improvement, build technical capabilities, and increase awareness of the environmental and financial benefits of energy efficiency. By the end of 2016, we conducted 34 energy audits at supplier facilities. These audits identified over $55 million in annual savings opportunities, with an average payback period of about 1.4 years. In 2016, the energy efficiency improvements made by suppliers avoided more than 150,000 metric tons of carbon dioxide equivalents (CO₂e).² In 2016, we implemented an energy training program and conducted training for 19 supplier sites. Trainees from these supplier sites applied their skills and identified and implemented additional energy efficiency projects. We are continuing to expand the program for even greater impact, focusing on creating systems to educate and reach a broader supplier base. Top contributors to our manufacturing carbon footprint 35% Integrated Circuits 29% Aluminum 13% Boards and Flexes¹ 5% Display 4% Glass Environmental Responsibility Report | 2017 Progress Report, Covering FY2016 7 Our efforts go beyond energy efficiency to spur the development and procurement of renewable energy within our global supply chain. We’re investing in renewable energy projects to address upstream emissions that are beyond the influence of our direct suppliers. To date, Apple has installed 485 megawatts of wind and solar projects across six provinces of China. Using these projects as a model, our direct suppliers are developing their own renewable energy projects, many of which are already under way. It’s all part of the clean energy program we launched in 2015. As part of our clean energy program, Apple and our suppliers will generate and procure more than 4 gigawatts of new clean power worldwide by 2020, including 2 gigawatts in China alone, and use it to reduce emissions associated with manufacturing. Already, commitments made as of April 2017 represent a total of 2 gigawatts. Once completed, the 4 gigawatts of clean power will represent 30 percent of our current manufacturing carbon footprint. Because it can be difficult for suppliers to access clean energy, we also launched the Clean Energy Portal. It offers regional guidance and tools for procuring clean energy and is available in the languages spoken where the majority of our manufacturing takes place—including Mandarin, Japanese, and Korean. Progress toward 4 gigawatts To date, seven suppliers have committed to 100 percent clean energy for Apple production. In addition, Apple has installed 485 megawatts of wind and solar projects across six provinces of China to address upstream emissions and serve as a model for suppliers. Apple is constantly evaluating the global energy policy landscape to best support suppliers and regulations that promote energy efficiency and renewable energy. Renewable technologies are rapidly developing, the economics of renewable energy are evolving, and energy and carbon policies are in flux. We engage with governments in our key manufacturing markets, ensure that our program is aligned with their priorities, and encourage policies that scale renewable energy capacity and enable utility customers to choose their energy source. While some of our suppliers have deep expertise in energy and climate change, many do not. Through the Clean Energy Portal, Apple is now able to share our global insights and updates on renewable energy with hundreds of manufacturers around the world. We’re giving manufacturers better technical, economic, and policy data to accelerate their transition to clean energy. Partners committed to 100 percent renewable energy for Apple production by 2018 • Biel Crystal Manufactory Ltd. • Catcher Technology • Compal Electronics • Ibiden • Lens Technology • Solvay Specialty Polymers • Sunwoda Electronics An increasing number of suppliers have committed to using only renewable energy to produce Apple parts and products. Download Supplier Update ⃝↓ Our 4 gigawatts of renewable energy projects by 2020 will produce clean power equivalent to taking more than 1.5 million cars off the road every year for over 20 years.³ 0 1 2 3 4 Operational Committed Goal Environmental Responsibility Report | 2017 Progress Report, Covering FY2016 8 Our direct partners are already making a big difference. Ibiden, which produces integrated circuit packaging substrates, has committed to generating renewable energy equivalent to the energy used to make Apple products by the end of 2018. Ibiden will be our first supplier in Japan to make the switch. Its floatovoltaic project will be one of the largest floating solar projects in the country. Biel Crystal Manufactory Ltd. is another great example of leadership—it has already contracted 50 percent of its Apple energy load to come from wind and solar and will increase this to 100 percent in 2018. Other partners across our supply chain are installing or investing in sizable solar projects, running their factories on wind power, and purchasing clean energy from reputable utility programs. The transition to renewable energy can be highly technical. It often requires complicated deal structures across many regions with their own regulatory requirements. Apple is experienced in sourcing and building renewable energy—quickly and at a high standard across the globe—so we are working alongside our suppliers to overcome many of these challenges. For example, in China direct power purchases for renewable energy are rare. Our teams sought guidance from the national government and stakeholders, made introductions between our suppliers and reputable renewable energy developers, and coordinated discussions with local government. Our suppliers have now entered into cost-effective renewable energy power purchase agreements in a number of provinces—among the first of their kind in China, paving the way for others to follow. Ibiden’s floating solar project in Japan will help it reach its 100 percent renewable energy goal for Apple by the end of 2018. Environmental Responsibility Report | 2017 Progress Report, Covering FY2016 9 Lowering carbon emissions by focusing on aluminum. We sell millions of phones. So making even small adjustments to the production of iPhone can have a powerful impact on our carbon footprint. For instance, we changed how we make the aluminum enclosure because the emissions associated with aluminum manufacturing across all Apple products represented close to 30 percent of our manufacturing carbon footprint. We prioritized aluminum that was smelted using hydroelectricity rather than fossil fuels. And we reengineered our manufacturing process to reincorporate the scrap aluminum. As a result, the iPhone 7 enclosure uses 27 percent less virgin aluminum than iPhone 6, and emits 60 percent less greenhouse gas emissions. Applying the same approach to the 13-inch MacBook Pro with Touch Bar resulted in 48 percent less greenhouse gas emissions associated with the aluminum enclosure compared with that of the previous-generation MacBook Pro. Our goal is to power our facilities worldwide with 100 percent renewable energy. In 2016, 96 percent of the electricity we used at our corporate facilities came from clean, renewable sources. That number now factors in the footprints of not only our offices, retail stores, and the data centers we run ourselves but also our product distribution centers and leased, colocated data centers. These efforts have lowered emissions from our facilities to 1 percent of our comprehensive carbon footprint. But our goal is to make them entirely renewable. We’ve already reached that goal in every single Apple-operated data center and across all our facilities in 24 countries— including the United States, the United Kingdom, China, and Australia. Apple’s renewable energy use Previous generation 13-inch MacBook Pro Greenhouse gas emissions associated with the aluminum enclosure of the 13-inch MacBook Pro with Touch Bar are 48 percent less than the previous generation. 100% 75% 50% 25% 0% ’10 ’11 ’12 ’13 ‘14 ’15 ’16 Apple (worldwide) Apple (U.S.) In just six years, Apple’s use of renewable energy to power its corporate facilities, retail stores, and data centers worldwide went from 16 percent in 2010 to 96 percent in 2016. Environmental Responsibility Report | 2017 Progress Report, Covering FY2016 10 We’re building the greenest corporate headquarters on the planet. Apple Park in Cupertino is on track to be the largest LEED Platinum–certified office building in North America—and that includes facilities dedicated to energy-intensive research and development. It’s powered by 100 percent renewable energy, 75 percent of which is generated onsite by a 17-megawatt rooftop solar installation and 4 megawatts of baseload biogas fuel cells. Any additional energy required is drawn from the California Flats Solar Project in nearby Monterey County. When the building has less use—on weekends, for example—it will actually generate renewable energy that’s delivered to Pacific Gas and Electric for use in the public grid. Over 80 percent of the new campus is open space with more than 9000 drought-tolerant trees. Most of them are oak, and many are shade and fruit trees. We also reclaimed old-growth oak trees from California landscapes where they would otherwise have been destroyed. To conserve water, the new campus uses 75 percent recycled nonpotable water to care for its dense forest and to run other onsite facilities where fresh water isn’t required. In 2016, Apple opened a new 38-acre campus in Austin, Texas, housing more than 5300 employees. The project is expected to be certified to the Gold level of the U.S. Green Building Council’s LEED rating system. The development’s environmental design features include LED lighting, high-efficiency water fixtures, stormwater detention ponds and wetland treatment, and native drought-tolerant plants, which will be irrigated using a 600,000-gallon rainwater cistern. Together, the environmental design features are expected to save over 6,692,000 kilowatt-hours, 26,700 therms of energy, and 4,336,200 gallons of water each year, compared to local building code requirements. During construction, 94 percent of building demolition waste was either reused or recycled. In addition, the Austin campus contains a 1.4-megawatt distributed rooftop solar installation, which is anticipated to generate up to 1,959,900 kilowatt-hours of renewable energy each year. Any additional electricity needs will be covered by the local utility’s 100 percent renewable green energy program. The campus’s central plant also makes use of thermal ice storage, making ice at night to be used for daytime cooling, reducing the draw on the power grid during peak times. Apple Park is populated by over 9000 trees, including more than 7000 newly planted shade and fruit trees. 95 percent of the material from the demolished buildings at the site was recycled or reused in the new Apple campus. Environmental Responsibility Report | 2017 Progress Report, Covering FY2016 11 Apple’s renewable energy projects (megawatts) Apple has installed 315 megawatts of Apple-owned renewable energy projects and projects with long-term agreements. An additional 618 megawatts of renewable energy projects are in construction. This does not include Apple-owned projects supporting the supplier clean energy program, such as the 485 megawatts of solar and wind projects in China. Producing renewable energy to meet our own needs. Burning coal, oil, or natural gas to produce electricity releases carbon dioxide and other greenhouse gases into the atmosphere. So we’ve committed to power all our corporate offices, retail stores, and data centers worldwide using only renewable energy. We’re producing a lot of it ourselves, developing our own solar, fuel cell, water, and wind projects. For example, we connected 40 megawatts of new solar energy to China’s national grid, producing more than enough electricity for all our corporate offices and retail stores in China. Since 2011, these projects have reduced the emissions from our offices, data centers, and retail stores worldwide by 60 percent and prevented more than 1.6 million metric tons of CO₂e from entering the atmosphere. In 2016 alone, they reduced CO₂e emissions by nearly 585,000 metric tons. Without renewable energy, these emissions would have more than tripled since 2011. We’ve also issued a $1.5 billion green bond, which is dedicated to financing environmental projects, including renewable energy initiatives at our facilities around the world. Apple scopes 1 and 2 building emissions Worldwide corporate, data centers, and Apple Stores Since 2011, Apple has reduced emissions from our offices, data centers, and retail stores worldwide by 60 percent. Without renewable energy and energy efficiency measures, these emissions would have increased over 200 percent since 2011. In fiscal year 2016, we added colocation facilities and distribution centers to our electricity footprint, contributing to the increase in default emissions. More detailed emissions data is provided in Appendix A. In February 2017, we issued our first Green Bond report, covering fiscal year 2016. Download now ⃝↓ Default grid emissions Total emissions if Apple had no renewable program Apple emissions Emissions after accounting for Apple’s renewable energy program 700,000 600,000 500,000 400,000 300,000 200,000 100,000 FY 2011 FY 2012 FY 2013 FY 2014 FY 2015 FY 2016 0 metric tons CO2 equivalent 0 250 500 750 1000 Operational In Construction We worked with Sunseap to source 100 percent clean energy in Singapore from a first-of-its-kind project: roughly 32 megawatts of solar panels on more than 800 rooftops in the city. Environmental Responsibility Report | 2017 Progress Report, Covering FY2016 12 Our renewable energy strategy 2. Renewable energy Renewable energy ownership. Where feasible, we produce our own renewable energy by building our own renewable energy facilities, including solar arrays, wind farms, biogas fuel cells, and micro-hydro generation systems. Dedicated renewable energy contracts. Where it’s not feasible to build our own generation, we sign long-term renewable energy purchase contracts, supporting new, local projects that meet our robust renewable energy sourcing principles. Grid purchased renewable energy and environmental attributes. In cases where we aren’t able to create new renewable energy projects ourselves due to local constraints, we directly purchase renewable energy from newer projects in nearby markets, or through available utility green energy programs. When these options are not available, we are willing to procure strong renewable energy credits (RECs) tied to recently constructed renewable energy projects, applying the same rigor to our grid-purchased renewables as we do to our Apple-created renewables. When Apple acquires RECs, we require that they are Green-e Energy certified and come from the same power grid—and preferably the same state— as the Apple facility they support. 1. Energy efficiency An important first step in managing energy use is to ensure our facilities use as little as possible. That’s why we design them for maximum energy efficiency and regularly audit our facility energy use to identify further opportunities for energy optimization. Our renewable energy sourcing principles. We encounter many legal and regulatory frameworks around the world that limit our renewable energy supply options. In each location, we endeavor to choose the strongest approach available to us as defined by these guiding principles. Displacement. We seek to displace more-polluting forms of energy in the same electric grid region as our facilities. We accomplish this by taking power directly from Apple-owned installations and by delivering into the grid an amount of renewable energy equal to the amount of energy we take from that grid. Additionality. We strive to create new clean energy that adds to the energy sources already delivering to the grid. This generally means participating in renewable energy projects that would not have been built without Apple’s involvement. We make sure that the energy we count toward our goals is not counted toward regulatory obligations that utilities must meet, such as the Renewable Portfolio Standards adopted by many states. Accountability. We apply rigor in measuring and tracking our energy supply resources, and use third-party registries such as WREGIS and NC-RETS, certification programs such as Green-e Energy, and contractual provisions to ensure that all renewable energy supplied to Apple is supplied only to Apple. When no such system exists, we work with industry partners and governmental entities to create them. Wind Water Biogas fuel cell Geothermal Solar Environmental Responsibility Report | 2017 Progress Report, Covering FY2016 13 The cleanest energy is the energy you never use. We’ve made energy efficiency a priority across all of our facilities, seeing energy savings of 25 percent or more in the buildings assessed. We have conducted extensive energy efficiency projects at our corporate headquarters in Cupertino, California, and the surrounding Santa Clara Valley where we operate more than 180 buildings. We’ve done the same at other campuses with high energy use—such as Elk Grove and Austin. As buildings age and our working needs change, we’ve undertaken aggressive programs to improve the comfort and function of our facilities, while ensuring they require less energy. From efficiency improvements made over the past six years, in fiscal year 2016 we saved 55 million kilowatt-hours of energy—equivalent to the electricity needed to power 4500 homes for a year. The efficiency improvements include upgrading to LED lighting, retro-commissioning building controls, and upgrading heating, ventilation, and air-conditioning systems. When designing new buildings, we optimize energy through use of high-efficiency lighting and heating, ventilation, and air-conditioning systems and through careful selection of windows, insulation, shading, and roofing materials to reduce heating and air-conditioning loads. We’re lessening our impact when we commute or hit the road. Even as we shrink the carbon footprint of Apple’s facilities, we’re continuing to look for ways to reduce carbon emissions from business fleet vehicles, employees’ commute, and business travel. Those emissions grew by 8 percent in fiscal year 2016, primarily because our employee count increased by 15 percent in the same period. However, emissions from air travel and rental car mileage decreased despite our growth, reflecting an emphasis on only business-critical travel. We also offer our U.S. employees a transit subsidy of up to $100 per month, and at our Cupertino and surrounding Santa Clara Valley campus, we offer free coach buses to commute to and from our corporate offices. In fiscal year 2016, use of these coach buses increased by 4 percent. When Apple Park opens, we will add 700 new electric vehicle charging ports, over 1000 new campus bicycles, and a dedicated transit center. Transportation emissions metric tons CO2e metric tons CO2e/employee 200,000 160,000 120,000 80,000 40,000 FY13 FY14 FY15 FY16 0 2.0 1.5 1.5 0.5 0.0 FY13 FY14 FY15 FY16 Business Fleet Vehicles (Scope 1) Employees’ Commute (Scope 3) Business Travel (Scope 3) Transportation emissions per employee 100% Apple data centers are powered by 100 percent renewable energy. Environmental Responsibility Report | 2017 Progress Report, Covering FY2016 14 Product Usage We take responsibility for every watt of power you use on your device. The energy it takes to run your device during its expected lifespan is added to our carbon footprint. That includes the energy it takes to charge your device, which often comes from carbon-intensive sources such as coal or natural gas. So we’re always developing new ways to make our products as efficient as possible. For example, macOS puts storage media to sleep and runs processors in an ultralow power mode when you’re not hard at work. And when you are, it uses less energy for apps that are open but not visible, and pauses animated website plug-ins until you give the OK. It can even idle the processor to its lowest power state between keystrokes and while the display is on. These energy savings might seem tiny, but when multiplied by every Apple computer in the world, they’re huge. iMessage, FaceTime, and Siri run on 100 percent renewable energy. Every time you send an iMessage, make a FaceTime call, ask Siri a question, download a song, or share a photo, it takes energy. We’re proud to say that all those tasks are handled by Apple data servers running on 100 percent renewable energy. All told, in 2015 our data centers avoided 187,000 metric tons of CO₂e emissions. And in 2016, that number grew to more than 330,000 metric tons. When we need additional capacity, we work with third-party data centers. Even though we don’t own these colocation facilities, and share them with other companies, we still include them in our renewable energy goals. So we’re working with these providers to get them to 100 percent renewable energy too. And we’re proud that in 2016, more than 99 percent of their electricity came from renewable sources. Each of our data centers has unique design features that reflect the climate and other aspects specific to its location. Our data centers are built with the environment in mind, often including innovative energy efficiency measures. Our data centers in North Carolina, Oregon, and Nevada earned LEED Platinum certification from the U.S. Green Building Council—the highest level possible. For more information about Apple’s industry-leading efforts to green our data centers, see Appendix B. Environmental Responsibility Report | 2017 Progress Report, Covering FY2016 15 2008 2009 2010 2011 2012 2013 2014 2015 2016 23.2 24.2 21.8 17.7 14.6 11.2 8.8 8.4 7 Since 2008, we’ve reduced the average energy consumed by Apple products by 70 percent.⁴ MacBook Pro consumes 15 percent less energy than the previous MacBook Pro models. iMac consumes 97 percent less energy in sleep mode than the first generation. Mac mini consumes 40 percent less power when idle than the previous generation. And you can charge your iPhone 7 once a day for a year for only 61 cents.⁵ These advancements are bringing down our overall carbon footprint and your electricity bill at the same time. Product Transportation and Recycling We’re taking responsibility for shipping and recycling. We include all the energy used for shipping and recycling in our carbon footprint. So we make our devices lighter and our packaging smaller to consume less fuel when they’re transported by air and sea. Because it’s better for the environment, we ship by sea as often as we can. We’re also adjusting our recycling practices. When collecting end of life products, we maximize the environmental benefits of recycling by weighing the availability of local recovery technology with the impacts of shipping waste. When we have to ship recycled materials, we do it responsibly. And nothing is discarded unsafely. A10 iPhone 7 uses the A10 Fusion chip, which is the most powerful chip ever in a smartphone, and it’s extremely efficient. Product energy use (kWh/yr) We continue to reduce the average energy our products use compared with previous generations. 97% iMac consumes 97 percent less energy in sleep mode than the first generation. 7x Mac mini exceeds ENERGY STAR requirements by up to seven times.⁶ Apple Renew Recycle your Apple device at any Apple Store or request a prepaid shipping label online and send it to us. Learn more > Environmental Responsibility Report | 2017 Progress Report, Covering FY2016 16 Finite Resources Our goal is a closed-loop supply chain. Traditional supply chains are linear. Materials are mined, manufactured as products, and often end up in landfills after use. Then the process starts over and more materials are extracted from the earth for new products. We believe our goal should be a closed-loop supply chain, where products are built using only renewable resources or recycled material. We already have programs in place to ensure the finite materials we use in our products are sourced responsibly through strict standards and programs on the ground that drive positive change. We’re also challenging ourselves to one day end our reliance on mining altogether. To start, we’re encouraging more customers to recycle their old devices through Apple Renew. And we’re piloting innovative new recycling techniques, like our line of disassembly robots, so we can put reclaimed materials to better use in new products. It’s an ambitious goal that will require many years of collaboration across multiple Apple teams, our suppliers, and specialty recyclers—but our work is already under way. Closing the loop in our supply chain Resources In the future, can we make products without taking finite resources from the earth? Environmental Responsibility Report | 2017 Progress Report, Covering FY2016 17 To prioritize which materials to tackle first, we created Material Risk Profiles for 44 elements in our products. The profiles identified global environmental, social, and supply risk factors spanning the life of each material. We then combined the risk profiles with data that’s more specific to Apple, like how much of a material we use, how unique our use is, or where we think we can create the most change. The results from our first round of analysis reinforced the need to work on aluminum—which we had already identified as a priority through our carbon footprint work—and on materials like tin and cobalt. As we embrace the circular economy and embark on this journey, we’re tailoring our approach to the specific properties of each material and how we use it. Each project is a bit different. For aluminum, we found that one of the best sources of recycled material was our own products and processes. This is because we specify such a high grade of the material—it’s part of what makes our products so strong and durable. Today, the only way to keep aluminum at this level of quality is to keep a clean material stream—not to mix it with existing scrap aluminum, which is what typically happens at recycling facilities. Our challenge is to recover the aluminum from our products without degrading its quality. That’s why our investments in new recycling technologies are so important. Existing techniques, such as shredding, only recover a few kinds of materials and often diminish their quality. So we invented Liam, a line of robots that can quickly disassemble iPhone 6, sorting its highquality components with the goal of reducing the need to mine more resources from the earth. With two Liam lines up and running, we can take apart up to 2.4 million phones a year. It’s an experiment in recycling technology that’s teaching us a lot, and we hope this kind of thinking will inspire others in our industry. We’ve already begun using the reclaimed aluminum to build new devices. We took aluminum enclosures Liam recovered from iPhone 6, melted them down, and reused the material to create Mac mini computers that we use in our iPhone final assembly facilities. We wanted to show it was possible to use our own scrap to build new products. Now we’re looking for opportunities to expand this pilot. For tin, we took a different approach. Unlike aluminum, there is an existing market supply of recycled tin that meets our quality standards. So we are tapping into that supply for iPhone 6s, and now using 100 percent recycled tin for the solder on the main logic board, where the majority of tin in the device is found.7 Learn more about Liam, Apple’s experiment in disassembly technology. Download the white paper ⃝↓ Environmental Responsibility Report | 2017 Progress Report, Covering FY2016 18 But sourcing isn’t enough—we want to recover as much tin as we’re using and make sure it’s put back into the world’s supply. Unfortunately, tin is not recovered by all electronics recyclers. So we are working to identify tin recyclers and ensure that the material is being consistently recovered and recycled from our products. To start, we are sending iPhone 6 main logic boards recovered by Liam to a recycler who can reclaim the tin in addition to the copper and precious metals. We are now looking for ways to do this on a larger scale for tin—and apply what we’ve learned to other materials. For example, we’re experimenting with ways to recover cobalt from our lithium-ion batteries and use recycled cobalt. Throughout this process, we’re learning a lot about how to create closedloop supply chains. For some materials, sourcing recycled content will be sufficient as long as we ensure the same amount is recovered, recycled, and put back on the market. Where recycled content isn’t available at the desired quality, we can drive improvements in recycling technologies and a tighter closed loop—such as using material from old Apple devices to build new ones. And when there are materials for which recycling technologies don’t yet exist, we’ll need to invest in research and other technology solutions. For every 100,000 iPhone 6 devices, Liam has the potential to recover the following materials: Aluminum (1900 kg) Copper (800 kg) Gold (0.3 kg) Platinum Group Metals (0.4 kg) Silver (7 kg) Tin (55 kg) Rare Earth Elements (24 kg) Cobalt (550 kg) Tungsten (3.5 kg) Tantalum (2.5 kg) Liam is a line of robots that disassembles iPhone 6 into individual components, making it easier to recover finite resources such as aluminum, tungsten, and cobalt. Environmental Responsibility Report | 2017 Progress Report, Covering FY2016 19 We’re finding new ways to keep old materials out of landfills We’re committed to making sure all the waste created by our supply chain is reused, recycled, composted, or, when necessary, converted into energy. Reaching this goal requires collaboration among multiple Apple teams, local governments, and specialty recyclers, but we’ve already seen great success. In 2015, our facility in Cork, Ireland, was the first outside North America to receive UL’s Zero Waste to Landfill validation. And most recently, 17 of our 18 final assembly sites—including all 14 sites in China— have received UL’s Zero Waste to Landfill validation, diverting more than 240,000 metric tons of waste from landfills since January 2015. We’ve recently expanded this initiative to 25 more suppliers. When we first started working with suppliers, we found that facilities were already diverting on average 70 percent of the waste generated from manufacturing, cafeterias, and employee support facilities. The challenge was to address the remaining low- or no-value, mixed-waste materials that most recyclers will not accept. We worked closely with our suppliers to find innovative ways to reduce, recycle, eliminate, or incinerate this waste for energy recovery. For example, at many of our iPhone and Apple Watch final assembly facilities, we implemented waste sorting on the line to separate recyclable materials. We also implemented a component tray reuse program for iPhone, allowing single-use trays to flow through the supply chain multiple times. At other sites, suppliers established waste reduction campaigns and worked with local recyclers to process materials not previously accepted. In response to this program, all iPhone and Apple Watch final assembly suppliers now have “zero waste” or “green” teams to support this program and other environmental improvements. The impact of this program extends far beyond our suppliers’ walls: It has strengthened local recycling networks, increased the use of recyclable and reusable materials, and inspired other component suppliers who want to learn how to follow suit. At our corporate offices and retail stores, we’re creating robust recycling and composting programs to minimize the environmental impact of the waste we produce. In fiscal year 2016, we generated approximately 21.6 million pounds of waste, and diverted over 28.2 million pounds of materials from landfill through recycling and 13.7 million pounds through composting, due in part to a food scraps recovery program launched in 2016 for our offices in Sunnyvale, California. Our rate of landfill diversion was 66 percent in fiscal year 2016. We continue to work to improve our rate of landfill diversion through a variety of actions, including expanding composting at our corporate campuses, and pursuing a zero waste effort at our nearly 490 retail stores. Apple disposes of hazardous waste responsibly. We complete regular audits of the Transportation, Storage, and Disposal Facilities (TSDF), where hazardous waste is ultimately sent to be treated, incinerated, or recycled. Only facilities we audit and approve are allowed to accept and treat the hazardous waste Apple generates. We take this commitment seriously—if the TSDFs do not meet our strict standards for environment, health, safety, and waste management protocols, we switch facilities. 100% 90% 80% 70% 60% 50% 40% 30% 20% 10% FY12 FY13 FY14 FY15 FY16 Landfill diversion rate for office waste Waste, recycling, and compost data is collected or estimated for all Apple facilities, including our retail stores. Environmental Responsibility Report | 2017 Progress Report, Covering FY2016 20 2012 2013 2014 2015 2016 300 350 250 200 150 100 50 0 Water Use (millions of gallons) Retail Data Centers Corporate Renewable Resources When we use renewable resources, we make sure to use them responsibly. The earth’s most precious resources, like water and paper, are renewable if they’re managed responsibly. So we do everything we can to conserve them. We’re measuring our water footprint and finding ways to reduce or reuse water wherever possible. We’re also using paper and plastic more efficiently in our packaging, and tackling our zero-waste-to-landfill goals at our campuses and retail stores. And we’re committed to protecting and creating more sustainable forests than we’re using. We hold ourselves accountable for every drop of water we use. Water is essential to all life. We need it to drink, to grow our food, and to maintain natural ecosystems throughout the planet. And though water is a renewable resource, its scarcity makes it precious in many parts of the world. So we hold ourselves accountable for the water we use, whether at our headquarters in California or in our suppliers’ facilities around the globe. We’re constantly seeking ways to conserve water and discharge wastewater safely. At our own offices, data centers, and retail stores across the world, we monitor water use within our cooling, landscaping, and sanitation processes so we can develop targeted ways to conserve water. In fiscal year 2016, Apple used 630 million gallons of water, up 10 percent from the previous year. This increase was driven primarily by growth at our data centers, both from increased construction and cooling needs. We have also transitioned our Mesa, Arizona, facility from a corporate office to a data center. Corporate water use We calculate our corporate water use for our data centers, retail stores, and corporate offices. Environmental Responsibility Report | 2017 Progress Report, Covering FY2016 21 Using the water risk analyses we began in 2015, we have targeted water conservation efforts at some of our highest-priority locations, based on water stress and use. These include our offices in Santa Clara Valley and Israel, as well as our data centers. In Santa Clara Valley, we continued to expand our deployment of high-definition flow sensors and sub-meters in our landscaping. This will reduce irrigation water use by up to 30 percent compared with fiscal year 2015—saving about 15.3 million gallons per year. Once opened, Apple Park will use recycled water from the city of Sunnyvale for flushing, cooling and irrigation needs, reducing our freshwater usage by over 20 million gallons annually. In Israel, our buildings have installed a smart water monitoring and leak detection system to conserve water, a system that is now being tested in Santa Clara Valley offices. As a result of these conservation efforts, our corporate water use per employee declined by 2 percent in fiscal year 2016. We also installed extensive sub-metering at our data centers to pinpoint areas of use, detect leakage, and develop better ways to conserve water. At our Maiden data center, our newest building uses captured rainwater for cooling, cutting our water needs by 50 percent from previous designs. Today, recycled water makes up 1 percent of our water usage across all facilities, and we continue to look for opportunities to reuse and recycle water. For example, we are working with the city of Prineville, Oregon, to build a wastewater treatment plant that will supply our cooling needs, reducing our reliance on potable water and leaving it available for other users. We’re planting more than 9000 droughtresistant trees at our new campus in Cupertino. We selected many tree varieties that were native to the area as well as others that could thrive in a range of climate change scenarios. Environmental Responsibility Report | 2017 Progress Report, Covering FY2016 22 The vast majority of our product water footprint is found in manufacturing, so in 2013 we established the supplier Clean Water Program to help our partners conserve water and prevent water pollution. We put a special emphasis on working with suppliers with high water usage and in water scarce regions, as well as makers of components that our life cycle water assessments have identified as particularly water-intensive. These life cycle assessments include water that’s consumed in energy production— such as for oil extraction, distillation, and processing—as well as nonenergy sources including water consumed during metals processing and product recycling. Through employee training, baseline assessments, performance evaluations, and technical support, we helped our suppliers conserve more than 3 billion gallons of water in 2016 alone, increasing average water reuse to 36 percent across 86 sites. And since many of our suppliers also build components for other companies, we’re reducing the water footprint of non-Apple products too. Since our Clean Water Program began, we’ve helped our suppliers save more than 8 billion gallons of water—enough to provide every person on the planet with 18 glasses of water. 8 billion 0 50 100 150 200 250 Data Centers Corporate Offices Retail Stores Millions of gallons Low Low-Medium Medium-High High We mapped our water use to different levels of water risk (as defined by WRI’s Aqueduct tool) across the world to understand where we should be focusing our conservation efforts. Water risk takes into consideration indicators such as water scarcity, business risk, and habitat and livelihood impact to the basins in which we operate. Source: World Resources Institute (WRI) Aqueduct, www.wri.org/our-work/project/aqueduct How we think about water. The impact of water use varies significantly depending on the watershed conditions where the water is being used. So we’ve continued to look at more sophisticated ways to measure and analyze our water use. The way we manage water is different based on the climate and nature of our operations across our facilities, whether it’s our data centers, corporate offices, manufacturing sites, or retail stores. We map our global water use against scarcity indicators. This analysis helps us prioritize our conservation efforts across our operations. Corporate water use by level of risk (FY2016) Environmental Responsibility Report | 2017 Progress Report, Covering FY2016 23 We’re not just protecting forests. We’re protecting future generations of them. Forests provide wood fiber for the paper we use in our packaging. They also clean our air, purify our water, and shelter wildlife. So we work hard to minimize our impact by sourcing paper responsibly and using it as efficiently as possible. But that’s not enough. The world’s forests still face widespread destruction due to illegal logging, poor management, and aggressive land development. That’s why we’re determined to protect and create enough sustainably managed forests around the world to cover all our packaging needs and produce fiber for generations.⁸ Using paper more efficiently. We’re constantly looking for ways to make our packaging smaller, creating technologies that use paper more efficiently, and using recycled paper whenever we can. In fiscal year 2016, we used 131,000 metric tons of fiber, of which 62 percent was recycled, 38 percent was virgin fiber from responsibly managed sources, and less than 1 percent was virgin fiber that did not comply with our sustainable fiber specification. We’re also designing our packaging to use fewer plastics, in favor of renewable, responsibly sourced fiber. For example, the accessory tray in the iPhone 7 box is made from a mix of sustainably harvested bamboo fiber and bagasse, a waste by-product of sugarcane manufacturing. Fiscal year 2016 fiber footprint 131,000 metric tons 62% 38% <1% Recycled fiber Responsibly sourced fiber Other virgin fiber Our fiscal year 2016 fiber footprint includes all paper used to package and ship products, as well as all in-box paper and paper retail bags. This year, we also included our corporate paper use, which accounts for about 1 percent of our total footprint. We calculate our fiber footprint to reflect fiber losses during the paper production process. Note: Due to rounding, total percentages don’t add up to 100. All our suppliers must adhere to Our sustainable fiber specification. Download now ⃝↓ Environmental Responsibility Report | 2017 Progress Report, Covering FY2016 24 Sourcing virgin paper responsibly. When we use virgin paper in our packaging, our suppliers must source it from sustainably managed forests or controlled wood sources. And we conduct regular audits to ensure that they adhere to our specifications. In fiscal year 2016, over 99 percent of the paper used in our packaging and corporate offices was from either sustainably managed forests or controlled wood or recycled sources. 53% The 21.5-inch iMac product packaging consumes 53 percent less volume and weighs 35 percent less than packaging for the original 15-inch iMac. 84% U.S. product packaging of iPhone 7 uses 84 percent less plastic than in the previous-generation iPhone packaging and contains 60 percent recycled content. 100% For the paper used in packaging iPad Pro, 100 percent comes from responsibly managed forests or is made from post-consumer recycled content. Protecting sustainable forests. We continue to protect and create sustainable working forests because when properly managed, they can provide abundant resources for a long time. In addition to specifying that all of our virgin fiber be sourced from responsibly managed forests, we also wanted to make sure we weren’t diminishing the world’s supply of responsibly sourced paper. So we set a goal to protect or create enough responsibly managed forests to cover all of our product packaging needs. In 2017, we met this goal for the first time: Yearly production from our forest conservation projects is now greater than the amount of virgin fiber used in Apple’s product packaging during fiscal year 2016. As our paper demands grow and change, we will continue protecting and creating enough responsibly managed forests to cover all our packaging needs. In partnership with The Conservation Fund, we’ve protected 36,000 acres of sustainable forest in the Eastern United States. In Maine, we’re protecting more than 32,400 acres in the Reed Forest, which includes wetlands and upland forest habitats that are important for numerous wildlife species in Maine’s iconic North Woods. This project adds to more than a million acres of conserved lands and interconnected forest habitat that stretches into Canada, and provides habitat to rare and threatened Environmental Responsibility Report | 2017 Progress Report, Covering FY2016 25 plants and animals like the elusive Canada lynx. The Reed Forest is certified to the Forest Stewardship Council (FSC) and Sustainable Forestry Initiative (SFI) standards. In late 2016, Apple and The Conservation Fund donated a conservation easement to the Forest Society of Maine for the entire 32,400-acre property. The conservation easement ensures forests at Reed won’t be developed or converted to other uses, and promotes economically and ecologically sustainable production of fiber and other wood products. Apple supported the Fund’s donation of an endowment to the Forest Society of Maine, which will help ensure that the easement can be monitored and enforced for centuries to come. In North Carolina, we’re protecting more than 3600 acres of pine and hardwood forest in Brunswick County, along the southern coast of North Carolina. This property sits adjacent to the 17,000-acre Green Swamp Preserve, which helps enable connectivity and halts fragmentation for this National Natural Landmark. With high-quality pine savannas, along with striking and rare plants and flowers, like the carnivorous Venus fly trap, Brunswick has long been a conservation priority for local and state partners. The Conservation Fund is working to place a conservation easement to make sure the Brunswick forest stays a forest. The Brunswick forest is certified to the SFI standard. In 2015, we announced a five-year partnership with World Wildlife Fund (WWF) to transition up to one million acres of forest, across southern provinces of China, into responsible management by 2020. WWF’s work has three primary components: 1. Increase responsible management of working forests in China—by creating up to 300,000 acres of FSC–certified forests, and up to 700,000 acres of forests under improved management. 2.Improve China’s policy framework to encourage responsible forest management. 3.Establish long-term market incentives in China for responsibly sourced paper. In just two years, we’re close to achieving the first goal by transitioning approximately 320,000 acres of forest in China—nearly 500 square miles and 20,000 acres more than the project goal—toward FSC certification. This progress was made through collaboration with two companies in Hunan and Guangxi provinces, one of which will be the largest FSC-certified plantation area in the Chinese pulp and paper sector. WWF worked with both companies to create forest management plans and train their employees to identify High Conservation Value Forest—both necessary for FSC certification. 100% We have protected or created enough responsibly managed forests to cover the 49,000 metric tons of virgin paper we used in our packaging in fiscal year 2016. Environmental Responsibility Report | 2017 Progress Report, Covering FY2016 26 WWF has also secured commitments from eight forestry companies, representing over 450,000 acres, to improve their forest management practices. These companies are located in seven provinces of southern China⁹ that are at the heart of the commercial timber production area in China. Their experiences will not only benefit their own forest management, but also inform the development of a Best Practices Guideline, which is designed to influence other forest managers throughout the country. Our ambition is to shift the dynamics of the world’s paper market in both the short and long term, and in the process protect some of the world’s most important forests. © Theodore Kaye/WWF-China An aerial view of eucalyptus forests in Guangxi Province, China. In partnership with WWF, we have transitioned approximately 320,000 acres of forest in China into sustainable management. Environmental Responsibility Report | 2017 Progress Report, Covering FY2016 27 Product Durability A durable device is a greener device. When products can be used longer, fewer resources need to be extracted from the earth to make new ones. So we assess all of our products in our Reliability Testing Lab, using rigorous testing methods that simulate our customers’ real-world experiences with their devices. For example, we analyze how devices stand up to extreme heat and cold, exposure to water and everyday chemicals, and scratching tests from materials like steel wool and denim. In addition to industry-standard measures, we also devise our own tests and even build custom testing machinery. We design these tests based on our studies of user behavior and by analyzing returned products to fully understand any problems. In the event that something does break, we have programs like AppleCare and Apple-certified repair services to help our customers use their devices longer. We also release regular free software updates that keep our products current and extend their lives as long as possible. And we design those software updates to be compatible with older generations of products. macOS Sierra, for example, is compatible with Mac models dating back to late 2009. And when customers decide to upgrade to new devices, the old ones often have new lives with friends or family, or in the refurbished market through programs like Apple Renew. To ensure that they can stand up to repeated use, the keys on MacBook are pressed millions of times. Environmental Responsibility Report | 2017 Progress Report, Covering FY2016 28 Safer Materials How do we make sure our products stay safe for people and planet? We run our own environmental testing lab. To protect people and the planet, we set strict standards on the materials used in our devices, often going far beyond what’s required by law. We also built the Environmental Testing Lab, where our chemists and toxicologists look for any potentially harmful substances rather than waiting for a third party to identify them for us. One process we use involves laser-based instruments—just like the one used by the Mars rover to analyze soil samples—to ensure that our products are free of beryllium. The lab also uses tools like inductively coupled plasma mass spectrometry, X-ray fluorescence spectroscopy, and ion, liquid, or gas chromatography. If we find an issue, we work with the supplier to correct it. Since creating our Cupertino Environmental Testing Lab in 2006, we’ve grown it to over 20 times its original size, and have regularly updated it with state-of-the-art equipment. We’ve also been building out testing labs at our manufacturing facilities to test and validate products throughout the manufacturing process. Our scientists have cataloged and analyzed more than 20,000 individual parts. We started our Full Material Disclosure program to identify all the substances we use in all the parts we use. We’ve already looked at more than 20,000 individual components out of the 40,000 present in all our products, prioritizing materials that come into frequent skin contact and those present in greatest quantity, and we get data on more parts every day. We assess the different chemicals in those components using 18 different criteria. This helps us understand their effect on people’s health and on the environment. Learn more about how Apple is integrating toxicological assessments into our materials selection process. Download the white paper ⃝↓ Environmental Responsibility Report | 2017 Progress Report, Covering FY2016 29 We start this process early in the design and manufacturing phases so we can take appropriate actions to remove or replace hazardous chemicals. In some cases, few replacements are readily available, so we work with our suppliers to find substitutions, switch to another supplier that uses safer materials, or explore how to eliminate the need for that substance. It took us four years to remove polyvinyl chloride, or PVC, from our power cords and headphone cables. We tested dozens of formulations until we finally found the right blend of durability, safety, and environmental performance in the nonchlorinated and nonbrominated thermoplastic elastomers that we used as replacements. Biocompatibility To ensure the safety of Apple Watch, we make our own sweat. We carefully test all product materials that come in contact with skin. For example, many people are allergic to nickel, which is common in many alloys like stainless steel. So we do nickel leach testing on Apple Watch and other wearable devices to measure how quickly nickel can transfer from metal parts into sweat. We even create artificial sweat to conduct such tests. By placing different components in jars of the artificial sweat, we can closely monitor samples to ensure that nickel and other allergens and irritants stay where they belong. And we go far beyond sweat in our testing. We analyze materials that someone might put in their mouth—like an Apple Pencil you might chew on while considering the next line in your drawing—to make sure they’re safe. We also evaluate products after they’ve undergone extensive reliability testing to ensure that they remain safe for our customers, even after years of use and exposure to different environmental conditions. In an incubator that simulates the temperature of the human body, Apple Watch bands are placed in jars of artificial sweat to undergo analytical testing. Environmental Responsibility Report | 2017 Progress Report, Covering FY2016 30 Setting high standards for the safety of our products. And the people who help make them. We also work to protect the health and safety of the people who work in our supply chain. The standards we set for our suppliers go far beyond what’s required by law, like our Regulated Substances Specification (RSS) list, which identifies the toxic chemicals we limit or prohibit in our manufacturing processes and products. We lead audits that inventory chemical purchasing and map chemicals across our supply chain. During these audits, we also review our suppliers’ hazard assessments, industrial hygiene monitoring, risk controls, hazard communication, worker training, medical surveillance records, and chemical spill prevention plans. To date, we’ve conducted over 40 hazard assessments for all the chemicals in the cleaners and degreasers used in our final assembly sites. We’ve removed benzene, n-hexane, toluene, and chlorinated organic compounds from all of our final assembly sites, and we continue to work with our suppliers to help them better manage chemicals used in manufacturing processes. And for suppliers with higher-than-average risks of occupational health exposure, we work with them even more closely to assess and improve chemical management practices. In addition to mapping chemical use annually across all final assembly sites, our team of experts works with suppliers to assess their manufacturing process and identify substitutions or opportunities for reenginering wherever possible. We’ve already assessed 81 manufacturing sites, including all 18 of our final assembly sites and 63 subcomponent supplier sites—together employing approximately 860,000 workers. And we plan to assess 50 more sites in 2017. 100% At our 18 final assembly facilities, 100 percent of all process chemicals were free of Apple-restricted substances. All our suppliers have to adhere to our Regulated Substances Specification. Download now ⃝↓ Environmental Responsibility Report | 2017 Progress Report, Covering FY2016 31 Eliminating Toxins The worst toxins and what we’ve done about them. After we identify toxins in our products, we reduce them, remove them, or develop new materials that are safer. These efforts also remove toxins from our manufacturing and recycling processes, which protects workers and keeps pollutants out of the land, air, and water. Beryllium Eliminated from all new product designs. Beryllium is found in copper alloys used to make connectors and springs. Mercury Eliminated in 2009. We use energyefficient, mercury-free LEDs and OLEDs instead of mercury-based fluorescent lamps in all our displays. Lead Phased out of display glass and solder in 2006. Arsenic Eliminated from display glass since 2008. Arsenic was traditionally used in glass. PVC and Phthalates Replaced with safer thermoplastic elastomers.¹⁰ Both are still used by other companies in power cords and headphone cables. Brominated Flame Retardants (BFRs) Eliminated from thousands of parts such as enclosures, cables, circuit boards, and connectors in 2008. We use safer metal hydroxides and phosphorus compounds in their place. Environmental Responsibility Report | 2017 Progress Report, Covering FY2016 32 Better Together Can we be a ripple in the pond to inspire greater change? No one company can solve the world’s challenges alone. So we engage across sectors, listen to diverse perspectives, and share the latest research to identify the solutions. For 2016, Apple increased our focus on inspiring others, influencing public policy, and contributing to improving global outcomes beyond the borders of our business interests. We deepened our engagement with key organizations, shared our vision and our journey at important conferences and events, collaborated with peer organizations, supported legislative efforts through advocacy, and found new ways to engage with our customers on the importance of protecting our planet. Joining forces with other organizations. We’ve increased our memberships and engagement in industry, sustainability, and cross-sector organizations. These organizations provide the opportunity for us to share our knowledge while learning from subject-matter experts in strategic areas. We prioritize associations that share our values, passion, and deeply held belief that companies can make a difference. Great relationships are built over time. So we have renewed our commitments to Ceres, the Ellen MacArthur Foundation, Corporate Eco Forum, the World Business Council for Sustainable Development (WBCSD), the GreenBiz Executive Network and the Paulson Institute, among others. And we’ve expanded our relationship with Advanced Energy Economy (AEE), becoming members of its Leadership Council. We formed our own Green Chemistry Advisory Board, made up of some of the world’s leading toxicologists, researchers, and academics. The board helps us identify innovative ways to minimize or eliminate toxins from our supply chain. We also invite experts from around the world to meet with leaders at Apple. Together, we focus on eliminating toxins at each stage of our process. Environmental Responsibility Report | 2017 Progress Report, Covering FY2016 33 In 2016, we joined several influential organizations, including: • RE100, an initiative by The Climate Group, created to support companies that commit to 100 percent renewable energy. Our membership in RE100 will enable us to collaborate with other clean energy leaders across various sectors, and provide us the opportunity to share our approach to driving clean energy in the manufacturing supply chain. • ChemSec, a Swedish-based nonprofit that works with decision-makers, industry, NGOs, and scientists to achieve a toxic-free environment. As members of its Business Group, we will work with like-minded companies across a diversity of sectors to refine our knowledge of safer materials. • The Aluminum Stewardship Initiative, a global, multi-stakeholder, nonprofit organization that sets standards and certifies sustainability performance. ASI membership is an important piece of our efforts to source aluminum responsibly and advance the transition to cleaner sources across the entire industry. Collaborating for joint success. This year, we’ve continued to work with cross-sector companies, researchers, suppliers, thought leaders, and technical experts to forge new paths, build unique solutions, and inspire others to continue their efforts. We are building relationships with key academic institutions worldwide. Our CEO, Tim Cook, sits on the Advisory Board of Tsinghua University’s School of Economics and Management in Beijing, where we are funding a $3 million endowed chair professorship focused on Responsible Innovation. We also collaborated with Tsinghua to launch an App Innovation Contest and a Green Innovators program, focusing on creative solutions to environmental challenges, governance, and public administration through entrepreneurship. Our partnership with app developers and customers across the world led to Apps for Earth, an initiative that generated over $8 million to support World Wildlife Fund’s global environmental projects. The projects, spanning all seven continents, will focus on funding conservation in seven key areas: • Conserve coastal riches by expanding and reinforcing marine protected areas, conserving critical migratory corridors for marine life, and protecting the livelihoods of coastal communities for future generations. • Combat climate change by piloting low-impact, habitat-friendly energy usage in Arctic communities, protecting critical habitat areas of the Arctic, and leveraging corporate purchasing activity to power the shift to renewables. Environmental Responsibility Report | 2017 Progress Report, Covering FY2016 34 • Preserve forests by enhancing forest protections, creating habitatfriendly development plans in emerging economies, and reenforcing community stewardship efforts. • Ensure sustainable food sources by engaging with communities to advance sustainable agriculture practices, expand food access and livelihoods, and influence business and retailers to make smart choices to protect the planet for future generations. • Provide safe and secure water by advancing efforts to restore a critical binational river system, highlighting links between vulnerable water systems and global security, and creating a model of success for regional water and sanitation development. • Save sea turtles and tigers by enhancing technology for tracking, and protecting critical habitats. • Harmonize people, nature, and wildlife by deploying new technologies to protect key species, and strengthening communities to reduce human-wildlife conflict. For 10 days in April 2016, Apple and 24 developers worked together to launch Apps for Earth, a global campaign to benefit WWF and help the planet, one app at a time. Environmental Responsibility Report | 2017 Progress Report, Covering FY2016 35 Sharing best practices. We believe that sharing our vision and our commitment can make a difference well beyond Apple’s business. To increase our impact, our team presented at several notable conferences, meetings, and events, including: • The Clean Energy Ministerial (CEM7) and Low Carbon Technology Partnerships initiative conferences, both in San Francisco, where we advocated for climate action by companies and stronger clean-energy policies by governments. • Electronics Goes Green conference in Berlin, where we shared our progress on circular economy, resource efficiency, and safer materials. • Ceres Conference in Boston, where we discussed the importance of integrating safer materials strategies into product design processes. • Climate Week in New York City, where we shined a spotlight on our work to gain renewable energy commitments from our manufacturing suppliers. Advocating for strong policies. We believe it’s important to stand alongside those who share our values and our passion for this work. To defend the best ideas and to amplify our beliefs. And to speak out when our voice will have a powerful impact. In April 2016, Apple joined Google, Microsoft, and Amazon to sign an amicus brief in support of the Environmental Protection Agency’s Clean Power Plan. As leading U.S. businesses, we wanted to send a clear message to lawmakers that renewable energy is great for business. In June 2016, Lisa Jackson addressed 700 senior government, business, and community leaders, at the seventh Clean Energy Ministerial, where she called for governments across the world to put a price on carbon to address climate change. Environmental Responsibility Report | 2017 Progress Report, Covering FY2016 36 Appendix A Apple’s Operations: Environmental Data Facilities Environmental Key Performance Indicators (Page 37) Scopes 1 and 2 Building Carbon Emissions (Pages 38–39) Fiscal Year 2016 Natural Gas and Electricity Use (Page 40) Environmental Responsibility Report | 2017 Progress Report, Covering FY2016 37 KPI Unit Fiscal Year 2016 2015 2014 2013 2012 Greenhouse Gas Emissions Scope 1 metric tons CO₂e 34,320 28,100 28,490 29,300 21,220 Natural gas, Diesel, Propane² 26,954 19,360³ 20,710 22,090 14,300 Fleet vehicles 7370 8740 7780 7210 6920 Scope 2⁴ 41,600 42,460 63,210 91,510 139,160 Scope 3⁵ 303,910 312,910 259,130 225,630 202,060 Business travel 117,550 139,940⁶ 110,940 90,948 85,090 Employee commute 186,360 172,970 148,190 134,685 116,970 Total Facilities Emissions (Scopes 1, 2, 3) 379,830 383,470 350,830 346,440 362,440 Energy Use Electricity million kWh 1450 996 839 708 608 U.S. 1170 831 702 590 — International 280 166 137 118 — Natural gas million btu 974,570 851,660 922,860 764,550 304,000 U.S. 901,950 794,830 840,490 676,630 240,230 International 72,620 56,830 82,370 87,920 63,770 Energy Efficiency⁷ Electricity saved as a result of energy efficiency measures (cumulative since 2011) kWh 55,288,800 37,875,000 31,225,000 26,241,600 11,354,200 Natural gas saved as a result of energy efficiency measures (cumulative since 2011) million btu 4,448,300 2,706,900 2,041,900 1,543,600 54,900 Renewable Energy⁸ Renewable energy sourcing (calendar year) % 96 93 87 73 60 Emissions avoided as a result of renewable energy sourcing (scopes 1 and 2) metric tons CO₂e 585,000 362,000 283,000 214,000 118,000 Water Use Total million gallons 630 573 494 430 345 Data centers 207 166 113 69 57 Retail 99 111 103 94 71 Corporate 324 296 278 267 217 Waste Generation Landfilled pounds 21,618,850 13,110,880 6,833,000 5,923,810 4,850,160 Recycled 28,198,560 19,599,570 14,621,940 15,866,650 11,464,020 Composted 13,737,320 3,006,170⁹ —⁹ — — Hazardous waste 2,287,320 1,002,300 508,040 70,550 123,460 Landfill diversion rate % 66 63 68 73 70 Notes: Apple’s fiscal year is the 52- or 53-week period that ends on the last Saturday of September. The Company’s fiscal years 2016, 2015, and 2014 ended on September 24, 2016, September 26, 2015, and September 27, 2014, respectively, and each spanned 52 weeks. ¹As reported in Apple’s Annual Report filed with the SEC (Form 10-K) for the fiscal year ending September 24, 2016 (fiscal year 2016). ²Scope 1 emissions for fiscal year 2016 include 261,580 gallons of diesel use in emergency back up generators at data centers and 21,840 kg of propane in corporate offices. Scope 1 emissions for fiscal year 2016 now include natural gas use at distribution centers. ³In fiscal year 2015, we adjusted our methodology to better reflect locations where natural gas is used. We estimate natural gas usage in offices and retail stores where we are not billed based on usage (e.g., leased office space or retail stores within malls). This more accurate methodology resulted in a decrease in emissions in fiscal year 2015. ⁴Beginning in fiscal year 2016, we include distribution centers and colocation facilities as part of Apple’s electricity use and association greenhouse gas emissions. We had previously reported colocation center electricity use separately. ⁵Scope 3 emissions reported in this table include only those emissions associated with employee commute and business travel, calculated by employee miles traveled. Scope 3 emissions associated with product life-cycle emissions are disclosed separately. ⁶In fiscal year 2015, we adjusted our methodology to reflect actual travel instead of booked travel. Using this more accurate methodology revealed overestimates for previous years. ⁷Because energy efficiency measures have lasting benefits, energy efficiency savings are calculated cumulatively since 2011. ⁸We calculate and report our progress toward 100 percent renewable energy by calendar year. In calendar year 2016, we used 1,572 million kilowatt-hours of electricity worldwide. ⁹Prior to fiscal year 2015, composted quantities were reported as part of the “recycled” figure. Facilities Environmental Key Performance Indicators The following table summarizes key environmental performance indicators relating to Apple’s global facilities, including our data centers, corporate offices, and almost 490 Apple Stores, together occupied by 116,000 Apple employees.¹ Environmental Responsibility Report | 2017 Progress Report, Covering FY2016 38 Scopes 1 and 2 Building Carbon Emissions (metric tons CO₂e) Fiscal Year 2016 Scope 1¹ Scope 2² Location Default Utility Emissions³ Apple Emissions (incl. Renewable Energy) Default Utility Emissions³ Apple Emissions (incl. Renewable Energy) Corporate Cupertino, CA Elk Grove, CA Austin, TX Other U.S. Cork, Ireland Singapore China Other International 22,109 18,693 397 248 883 780 65 38 1005 20,537 17,121 397 248 883 780 65 38 1005 166,990 52,884 3790 32,305 7476 8915 8084 10,878 42,658 30,408 0 0 0 0 0 0 0 30,408 Data centers Maiden, NC Newark, CA Prineville, OR Reno, NV Mesa, AZ Colocation Facilities⁴ 28,731 26,119 139 1077 713 683 — 2738 126 139 1077 713 683 — 334,824 103,296 24,993 83,912 31,222 7601 83,800 2269 0 0 0 0 0 2269 Retail stores Domestic (U.S.) International 3679 1597 2082 3679 1597 2082 97,708 42,050 55,658 8924 0 8924 Totals 54,519 26,954 599,522 41,601 Fiscal Year 2015 Corporate Cupertino, CA Elk Grove, CA Austin, TX Other U.S. Cork, Ireland Singapore China Other International 16,960 14,792 369 233 121 892 0 117 435 15,423 13,256 369 233 121 892 0 117 435 106,134 42,074 3279 20,874 2715 6227 5310 9050 16,605 19,564 0 0 0 0 0 3767 2201 13,596 Data centers Maiden, NC Newark, CA Prineville, OR Reno, NV 24,543 24,530 0 13 0 136 123 0 13 0 186,586 99,907 26,519 39,507 20,653 0 0 0 0 0 Retail stores Domestic (U.S.) International 3800 2269 1531 3800 2269 1531 86,070 42,543 43,527 22,893 0 22,893 Totals 45,303 19,359 378,790 42,457 Fiscal Year 2014 Corporate Cupertino, CA Elk Grove, CA Austin, TX Other U.S. Cork, Ireland Singapore China Other International 16,716 14,310 411 148 115 1000 51 385 296 15,335 12,929 411 148 115 1000 51 385 296 86,842 36,496 2516 15,149 2270 7678 6852 8577 7304 21,555 0 0 0 0 0 6852 8577 6126 Data centers Maiden, NC Newark, CA Prineville, OR Reno, NV 26,854 26,835 0 18 0 18 0 0 18 0 148,320 92,306 38,278 10,392 7344 0 0 0 0 0 Retail stores Domestic (U.S.) International 5355 2812 2543 5355 2812 2543 82,770 45,041 37,729 41,658 11,036 30,662 Totals 48,924 20,708 317,932 63,213 Environmental Responsibility Report | 2017 Progress Report, Covering FY2016 39 Fiscal Year 2013 Scope 1¹ Scope 2² Location Default Utility Emissions³ Apple Emissions (incl. Renewable Energy) Default Utility Emissions³ Apple Emissions (incl. Renewable Energy) Corporate Cupertino, CA Elk Grove, CA Austin, TX Other U.S. Cork, Ireland Singapore China Other International 15,211 12,231 509 83 337 743 50 390 868 13,727 10,747 509 83 337 743 50 390 868 85,354 43,116 4400 12,162 2463 5320 5826 7490 4578 17,503 0 0 0 0 0 5826 7490 4187 Data centers Maiden, NC Newark, CA Prineville, OR Reno, NV 19,360 19,360 0 0 0 2201 2201 0 0 0 123,855 75,836 36,959 9965 1095 0 0 0 0 0 Retail stores Domestic (U.S.) International 6158 3548 2610 6158 3548 2610 77,425 44,606 32,819 74,002 44,606 29,397 Totals 40,729 22,086 286,634 91,505 Fiscal Year 2012 Corporate Cupertino, CA Elk Grove, CA Austin, TX Other U.S. Cork, Ireland Singapore China Other International 13,160 10,949 560 59 237 715 32 — 609 15,423 13,256 369 233 121 892 0 117 435 84,611 39,457 6952 10,635 4265 4801 4946 1049 12,505 48,215 25,450 0 0 4265 0 4946 1049 12,505 Data centers Maiden, NC Newark, CA Prineville, OR 146 146 0 0 46 146 0 0 87,732 52,977 33,492 1263 7664 0 7664 0 Retail stores Domestic (U.S.) International 2812 787 2025 2812 787 2025 83,285 — — 83,285 — — Totals 16,118 14,301 255,628 139,164 Fiscal Year 2011 Corporate Cupertino, CA Elk Grove, CA Austin, TX Other U.S. Cork, Ireland Singapore China Other International 14,425 11,007 556 45 564 804 — — 1449 12,656 9238 556 45 564 804 — — 1449 82,183 39,428 7930 10,139 2141 4598 3243 280 14,424 59,516 39,428 0 0 2141 0 3243 280 14,424 Data centers Maiden, NC Newark, CA 0 0 0 0 0 0 51,651 22,663 28,988 28,988 0 28,988 Retail stores Domestic (U.S.) International 2600 746 1854 2600 746 1854 65,769 — — 65,769 — — Totals 17,025 15,256 199,603 154,273 Notes: — Energy source not yet online. ¹Scope 1 emissions result from natural gas use for facilities, and gasoline use for fleet vehicles. As is typical, these emissions are tracked separately from our 100 percent renewable energy claim. ²Scope 2 emissions result from electricity use for facilities. In addition, in fiscal year 2014, Apple owned a facility in Mesa, Arizona, that was operated by a supplier, which had default grid emissions of 151,279 tons CO2e and effective emissions of 0 tons CO2e in fiscal year 2014. It was removed from operation in fiscal year 2015. ³Default Utility Emissions are based on utility-scale and regional default grid emission factors (using the most granular data set available). ⁴In FY2016, we began tracking electricity used at colocation facilities as part of Apple’s footprint. Environmental Responsibility Report | 2017 Progress Report, Covering FY2016 40 Fiscal Year 2016 Natural Gas and Electricity Use The chart below provides a detailed breakdown of fiscal year 2016 energy use, which is used to calculate our carbon emissions. Fiscal Year 2016 Natural Gas Electricity Location Total Gas (mmBTU) Renewable Biogas (mmBTU) Total Electricity (million kWh) Renewable Electricity (million kWh) Corporate Cupertino, CA Elk Grove, CA Austin, TX Other U.S.¹ Cork, Ireland Singapore China Other International¹ 414,003 351,905 7456 4668 16,552 13,767 0 1874 17,779 29,712 29,712 0 0 0 0 0 0 0 473 260 13 54 20 14 18 12 82 419 260 13 54 20 14 18 12 28 Data centers Maiden, NC Newark, CA Prineville, OR Reno, NV Mesa, AZ Colocation Facilities² 491,378 491,159 0 185 0 33 — 491,159 491,159 0 0 0 0 — 778 244 130 115 90 19 180 775 244 130 115 90 19 177 Retail stores Domestic (U.S.) International 69,197 29,994 39,203 0 0 0 203 99 104 191 99 92 Totals 974,577 520,871 1454 1385 Percent Renewable³ 53% 95% — Data not tracked ¹Includes energy used at distribution centers, beginning in FY2016. ²In FY2016, we began tracking electricity used at colocation facilities as part of Apple’s footprint. ³For ease of accounting, we calculate our progress toward 100 percent renewable energy on a calendar year basis, while we track and report all other environmental impacts on a fiscal year basis. In calendar year 2016, 96 percent of the 1,572 million kWh electricity we used came from renewable sources. Environmental Responsibility Report | 2017 Progress Report, Covering FY2016 41 Appendix B Data Center Energy Supplement Apple’s data center presence continues to grow. Each data center has unique design features that reflect the climate and other aspects of its specific site. All of our data centers operate on 100 percent renewable energy and power billions of iMessages, answers from Siri, and song downloads from iTunes. That means no matter how much data they handle, there is a zero greenhouse gas emissions impact from their electricity use. These data centers use renewable energy sources like solar, wind, biogas fuel cells, and micro-hydro power from onsite and locally obtained resources. Maiden, North Carolina On any given day, between 60 and 100 percent of our Maiden data center’s energy use is generated through 68 megawatts of Apple projects: two 20-megawatt solar arrays, an 18-megawatt solar array, and 10 megawatts of biogas fuel cells. In 2015, we took a new approach to support further growth at our Maiden data center: We partnered with the local utility, Duke Energy, to help build five solar PV projects through Duke Energy’s Green Source Rider program. These solar PV projects, which started coming online in late 2015 to support our Maiden data center, were Duke Energy’s first Green Source Rider projects to become operational. We worked with Duke Energy for several years to develop this green energy tariff option, which allowed Apple and Duke Energy to work together to develop new renewable energy projects. The five projects have a combined peak capacity of 20 megawatts. All told, Apple’s data center will be supported by projects that generate 244 million kilowatt-hours of renewable energy a year, which is equivalent to the energy used by 17,906 North Carolina homes.* Among Maiden’s energy efficiency features are the use of outside air cooling through a waterside economizer during night and cool-weather hours, which, along with water storage, allows the chillers to be turned off more than 75 percent of the time. *Carbon emissions equivalences calculated using U.S. Energy Information Administration, 2015 data: www.eia.gov/electricity/sales_revenue_price/pdf/table5_a.pdf. Environmental Responsibility Report | 2017 Progress Report, Covering FY2016 42 Maiden, North Carolina—100% renewable since opening June 2010 Duke Energy Default Grid Mix Apple Actual Renewable Energy Use Nuclear 51% Apple’s Solar PV Projects 36% Coal 33% Biogas Fuel Cells 28% Other 16% Duke Green Source Rider (100% Solar PV) 8% Renewable <1% NC GreenPower (80% solar) 36% 2016 Default Emissions (mtons CO₂e/year) 103,296 2016 Effective Emissions (mtons CO₂e/year) 0 From Duke Energy Carolinas 2015 Statistical Supplement generation data Actual fiscal year 2016 energy data Newark, California Our data center in Newark, California, is powered by 100 percent renewable energy. We hit this milestone in January 2013, when we began serving the data center with energy sourced primarily from California wind power. We’re acquiring this energy directly from the wholesale market through California’s Direct Access program. Late in 2017, when we anticipate the 130-megawatt California Flats solar project in Monterey County, California, to come online, we’ll use Direct Access to supply power from that project directly to our data center as well as other Apple facilities in California. Newark, California—100% renewable since opening January 2013 Pacific Gas & Electric Default Grid Mix Apple Actual Renewable Energy Use Natural Gas 25% Bundled Grid (mostly wind) 84% Nuclear 23% Grid (mostly wind) 16% Other/Unspecified 22% Renewable 30% 2016 Default Emissions (mtons CO₂e/year) 24,993 2016 Effective Emissions (mtons CO₂e/year) 0 https://www.pge.com/pge_global/common/pdfs/youraccount/your-bill/understand-your-bill/bill-inserts/ 2016/11.16_PowerContent.pdf Actual fiscal year 2016 energy data Prineville, Oregon To support our Prineville data center, we recently signed a 200-megawatt power purchase agreement for a new Oregon wind farm, the Montague Wind Power Project, set to come online by the end of 2018. This is our first Apple-created wind project. And it’s our largest project to date, producing over 560 million kilowatt-hours of clean, renewable energy a year. Additionally, we executed a power purchase agreement for the 56-megawatt Solar Star Oregon II PV array located just a few miles from our data center. The project comes online at the end of this year and will produce 140 million kilowatt-hours of renewable energy a year. To Wind Solar arrays + Fuel Cell Family Environmental Responsibility Report | 2017 Progress Report, Covering FY2016 43 strengthen the connection between Apple and these projects, we use Oregon’s Direct Access program to schedule the renewable energy from these projects directly to our data center. Also supporting the data center are two micro-hydro projects that harness the power of water flowing through local irrigation canals that have been operating for over 60 years. These micro-hydro projects generate 12 million kilowatt-hours of renewable energy a year. Supplementing these projects, and ensuring we remain 100 percent renewable all the time, we executed a long-term purchase agreement for all environmental attributes with Cypress Creek Renewables from a 50-megawatt portfolio of six solar arrays in Oregon. Prineville, Oregon—100% renewable since opening May 2012 Pacific Power Default Grid Mix Apple Actual Renewable Energy Use Coal 62% Apple’s Micro-Hydro Projects 5% Natural Gas 17% Oregon Wind 94% Other 6% Utility Green 1% Renewable 15% 2016 Default Emissions (mtons CO₂e/year) 83,912 2016 Effective Emissions (mtons CO₂e/year) 0 https://www.pacificpower.net/content/dam/pacific_ power/doc/About_Us/Rates_Regulation/Oregon/11536-9_ PP_ORLabelingInsert_LrgBiz_F.pdf Actual fiscal year 2016 energy data Reno, Nevada Unlike competitive energy markets where we’ve located some of our data centers, the regulated electricity supply in Nevada did not offer a simple solution for us to create new renewable energy projects dedicated to our data center. So we created a partnership with the local utility, NV Energy, to develop our first renewable project: the Fort Churchill Solar PV project. Apple designed, financed, and constructed the project, and NV Energy operates it and directs all the renewable energy it produces to our data center. The Fort Churchill Solar PV project uses a new kind of photovoltaic panel with curved mirrors that concentrate sunlight. The 20-megawatt array has an annual production capacity of over 43 million kilowatt-hours of clean, renewable energy. To facilitate further renewable development in Nevada, Apple worked with NV Energy and the Nevada utility commission to create a green energy option open to all commercial customers that does not require the customer to fund project development up front. Thanks to this new option, in late 2015 we announced our second Nevada solar array, a 50-megawatt project called Boulder II that came online in December 2016. We’re proud that another Nevada data center operator has also used the new green energy option, twice. Wind + Micro-Hydro Environmental Responsibility Report | 2017 Progress Report, Covering FY2016 44 Solar + Geothermal In early 2017 we again used the green energy option for our third Nevada solar array, a 200-megawatt project called Techren Solar—Apple‘s largest solar array to date. It is set to come online by the end of 2018 and is estimated to produce over 540 million kilowatt-hours of clean, renewable energy a year. Reno Nevada—100% renewable since opening December 2012 NV Energy – North Default Grid Mix Apple Actual Renewable Energy Use Natural Gas 52% Apple’s Solar PV Projects 53% Coal 22% Other Solar PV (PPA) 47% Other 3% Renewable 23% 2016 Default Emissions (mtons CO₂e/year) 31,222 2016 Effective Emissions (mtons CO₂e/year) 0 https://www.nvenergy.com/bill_inserts/2017/Power_ Content_Insert_NVE-North_2017-01.pdf Actual fiscal year 2016 energy data Mesa, Arizona Our newest data center, our global command center in Mesa, Arizona, came online in 2016. To support this facility, we partnered with the local utility, the Salt River Project, to build the 50-megawatt Bonnybrooke solar array, which became operational in October 2016. This project produces over 147 million kilowatt-hours of clean, renewable energy a year, which more than fully matches the energy used by the data center. Mesa Arizona—100% renewable since opening March 2017* Salt River Project (SRP) Default Grid Mix Apple Actual Renewable Energy Use Coal 53% SRP Solar PV Purchase 100% Nuclear 18% Natural Gas/Other 17% Renewable 12% 2016 Default Emissions (mtons CO₂e/year) 7601 2016 Effective Emissions (mtons CO₂e/year) 0 https://www.srpnet.com/about/stations/pdfx/2014irp.pdf Actual fiscal year 2016 energy data *Apple took operational control of the building in October 2015 and converted it to a data center that began servicing customers in March 2017. Viborg, Denmark We’re currently constructing a new data center running on 100 percent renewable energy in Denmark’s central Jutland region. Due to its proximity to one of Denmark’s largest electrical substations, the data center won’t require back-up generators, which typically run on diesel and require periodic testing and burning of fuel. The facility is designed to capture excess heat from its equipment and conduct it into the local district heating system to help warm homes in the community. Solar Array Environmental Responsibility Report | 2017 Progress Report, Covering FY2016 45 Denmark has a long tradition of biomass energy generation from agricultural waste products. Apple is partnering with Aarhus University (Viborg campus) to co-develop an agricultural waste biomass project. Methane from the biomass digester reaction will be used to create renewable electricity for our data center. Much of the agricultural waste going into the digester will come from local farms in a mutually beneficial relationship. They bring us their agriculture waste material to use as feedstock for the digester and we give them the nutrient-rich by product of the digestion process, which they can apply to their fields. Athenry, Ireland Our data center in County Galway, Ireland, will be built on recovered land that was previously used for commercial lumber. It will provide a forested outdoor education space for local schools and a walking trail for the community. When it opens, the data center will run on 100 percent clean, renewable energy, and will be cooled by natural ventilation, rather than mechanical air-conditioning, by taking advantage of the mild Irish climate. Ireland has one of the strongest coastal wave energy resources of anywhere in the world. Apple has partnered with the Sustainable Energy Authority of Ireland to support innovative new ways of capturing wave energy and converting it to renewable electricity, with Apple agreeing to use electricity generated from new wave energy technologies to support the Athenry data center. Through this partnership, Apple supports a new wave energy technology developed by the Irish company SeaPower and recently tested in Galway Bay. Our colocation facilities The vast majority of our online services are provided by our own data centers; however, we also use third-party colocation facilities for additional data center capacity. While we don’t own these shared facilities and use only a portion of their total capacity, we include our portion of their energy use in our renewable energy goals. Over 99 percent* of our power for colocation facilities is matched with renewable energy generated within the same state or NERC region for facilities in the United States, or within the same country for those around the world. And we will keep working with the colocation suppliers to get to 100 percent. Furthermore, we worked with one of our main suppliers of colocation services to help them develop the capability to provide renewable energy solutions to its customers. This partnership advances Apple’s renewable energy program and those of other companies that use this colocation provider. Beyond the use of our own data centers and colocation facilities, we also use third-party computing services to support some of our on-demand cloud storage-based services. We encourage these suppliers to adopt a 100 percent renewable energy strategy for their energy use. *In calendar year 2016. Environmental Responsibility Report | 2017 Progress Report, Covering FY2016 46 Energy Use and Emissions at Apple’s Colocation Facilities Energy Use (kWh) Renewable Energy (kWh) Default Utility Emissions¹ (metric tons CO₂e) Apple’s Emissions – including renewable energy² (metric tons CO₂e) % Renewable Energy FY2011 42,524 0 12 12 0% FY2012 38,552,271 1,471,680 17,220 16,543 4% FY2013 79,462,860 46,966,891 31,757 14,493 59% FY2014 108,659,693 88,553,380 44,338 10,976 81% FY2015 142,615,026 121,086,061 60,495 12,740 85% FY2016³ 180,205,500 176,774,556 83,800 2269 98% ¹We calculate “default utility emissions” to provide baseline emissions of what our carbon footprint would have been without the use of renewable energy. This allows us to demonstrate the savings resulting from our renewable energy program. ²Apple’s greenhouse gas emissions are calculated using the World Resources Institute Greenhouse Gas Protocol methodology for calculating market-based emissions. ³Over the past two years, we have been installing submeters in colocation facilities to better track electricity usage. Beginning in FY2016, we are reporting this submetered electricity usage. Prior to FY2016, reported electricity usage was conservatively estimated based on maximum contract capacity quantities. Regional Energy Use at Apple’s Colocation Facilities (Fiscal Year 2016) Energy Use (kWh) Renewable Energy (kWh) % Renewable Energy U.S. 127,286,720 127,286,720 100% Europe 27,576,768 27,576,768 100% APAC 24,750,670 21,906,038 89%* Other 591,342 0 0% FY2016 Total 180,205,500 176,769,526 98% *This value became 100 percent starting January 2016, bringing the total renewable energy figure to 99 percent for calendar year 2016. Environmental Responsibility Report | 2017 Progress Report, Covering FY2016 47 Appendix C Assurance and Review Statements Bureau Veritas: Corporate energy, carbon, waste and water data (Pages 48-50) Fraunhofer Institute: Product life cycle carbon footprint (Pages 51-54) Fraunhofer Institute: Corporate, retail, and product fiber footprint (Pages 55–56) Environmental Responsibility Report | 2017 Progress Report, Covering FY2016 48 BUREAU VERITAS NORTH AMERICA INDEPENDENT ASSURANCE STATEMENT Introduction and objectives of work Bureau Veritas North America, Inc. (BVNA) was engaged by Apple, Inc. (Apple) to conduct an independent assurance of select environmental data reported in its 2016 environmental report (the Report). This Assurance Statement applies to the related information included within the scope of work described below. The intended users of the assurance statement are the stakeholders of Apple. The overall aim of this process is to provide assurance to Apple’s stakeholders on the accuracy, reliability and objectivity of select information included in the Report. This information and its presentation in the Report are the sole responsibility of the management of Apple. BVNA was not involved in the collection of the information or the drafting of the Report. Scope of Work Apple requested BVNA to include in its independent review the following: Assurance of select environmental data and information included in the Report for the fiscal year 2016 reporting period (September 27, 2015 through September 24, 2016), specifically, in accordance with Apple’s definitions and World Resources Institute (WRI)/World Business Council for Sustainable Development (WBCSD) Greenhouse Gas Protocol: o Energy: Direct (Million Therms) and Indirect (Million kilowatt hours (mkWh)) o Renewable Energy (mkWH) o Water Withdrawal (Million Gallons) o Greenhouse Gas (GHG) Emissions: Direct Scope 1 emissions by weight, Indirect Scope 2 emissions by weight, Indirect Scope 3 emissions by weight (Employee Commute and Business Travel) (Metric Tonnes of Carbon Dioxide equivalent) o Waste Quantities and Disposition (Metric Tonnes) o Paper Quantities (Metric Tonnes) o Appropriateness and robustness of underlying reporting systems and processes, used to collect, analyze, and review the environmental information reported; Excluded from the scope of our work is any assurance of information relating to: Text or other written statements associated with the Report Activities outside the defined assurance period Methodology BVNA undertook the following activities: 1. Site visits to Apple facilities in Haifa and Herzliya, Israel; Austin, Texas; and Prineville, Oregon; 2. Visit to Apple corporate offices in Cupertino, California; 3. Interviews with relevant personnel of Apple (11 individuals including employees and external contractors at the corporate level); 4. Review of internal and external documentary evidence produced by Apple; 5. Audit of environmental performance data presented in the Report, including a detailed review of a sample of data against source data; and 6. Review of Apple information systems for collection, aggregation, analysis and internal verification and review of environmental data. Environmental Responsibility Report | 2017 Progress Report, Covering FY2016 49 Apple, Inc. Page 2 Our work was conducted against Bureau Veritas’ standard procedures and guidelines for external Verification of Sustainability Reports, based on current best practice in independent assurance. Bureau Veritas procedures are based on principles and methods described in the International Standard on Assurance Engagements (ISAE) 3000. The work was planned and carried out to provide reasonable assurance for all indicators and we believe it provides an appropriate basis for our conclusions. Our Findings BVNA verified the following indicators for Apple’s Fiscal Year 2016 reporting period (September 27, 2015 through September 24, 2016): Parameter Quantity Units Boundary/ Protocol Natural Gas Consumption: 9.7 Million Therms Worldwide occupied properties / Apple Internal Protocol Electricity Consumption: 1,454 Million kilowatt hours (mkWh) Worldwide occupied properties / Apple Internal Protocol Renewable Energy 1,385 Million kilowatt hours (mkWh) Worldwide / Invoiced quantities & self-generated Scope 1 GHG Emissions 34,000 metric tons of carbon dioxide equivalent (tCO2e) Worldwide occupied properties / WRI/WBCSD GHG Protocol Scope 2 GHG Emissions (Location-Based) 542,000 tCO2e Worldwide occupied properties / WRI/WBCSD GHG Protocol Scope 2 GHG Emissions (Market-Based) 41,600 tCO2e Worldwide occupied properties / WRI/WBCSD GHG Protocol Scope 3 GHG Emissions – Business Travel 118,000 tCO2e Worldwide occupied properties / WRI/WBCSD GHG Protocol Value Chain (Scope 3) Scope 3 GHG Emissions – Employee Commute 186,000 tCO2e Worldwide occupied properties / WRI/WBCSD GHG Protocol Value Chain (Scope 3) Water Withdrawal 630 Million gallons Worldwide occupied properties / Apple Internal Protocol Trash disposed in Landfill 9,800 Metric tonnes Worldwide occupied properties / Apple Internal Protocol Hazardous Waste (Regulated waste) 1,000 Metric tonnes Worldwide occupied properties / Apple Internal Protocol Recycled Material (Removal by recycling contractor) 12,800 Metric tonnes Worldwide occupied properties / Apple Internal Protocol Composted Material 6,200 Metric tonnes Worldwide occupied properties / Apple Internal Protocol Paper 1,100 Metric tonnes Worldwide occupied properties / Apple Internal Protocol Environmental Responsibility Report | 2017 Progress Report, Covering FY2016 50 Apple, Inc. Page 3 Our Conclusion Based on the assurance process and procedures conducted, we conclude that: The Energy, Water, Waste, Paper, and Scope 1, 2 & 3 GHG Emissions assertions shown above are materially correct and are a fair representation of the data and information; and Apple has established appropriate systems for the collection, aggregation and analysis of relevant environmental information, and has implemented underlying internal assurance practices that provide a reasonable degree of confidence that such information is complete and accurate. Statement of independence, impartiality and competence BVNA is an independent professional services company that specializes in Quality, Health, Safety, Social and Environmental management with over 180 years history in providing independent assurance services, and an annual 2016 revenue of $4.5 billion Euros. No member of the assurance team has a business relationship with Apple, its Directors or Managers beyond that of verification and assurance of sustainability data and reporting. We have conducted this verification independently and we believe there to have been no conflict of interest. BVNA has implemented a Code of Ethics across the business to maintain high ethical standards among staff in their day-to-day business activities. The assurance team has extensive experience in conducting assurance over environmental, social, ethical and health and safety information, systems and processes, has over 20 years combined experience in this field and an excellent understanding of BVNA standard methodology for the Assurance of Sustainability Reports. Attestation: Trevor A. Donaghu, Lead Verifier John A. Rohde, Technical Reviewer Technical Director, Climate Change Services Senior Project Manager Sustainability and Climate Change Services Sustainability and Climate Change Services Bureau Veritas North America, Inc. Bureau Veritas North America, Inc. April 10, 2017 CCF Letter of Assurance Client: Apple Inc. 1 Letter of Assurance Company Carbon Footprint – Scope 3: Product related Carbon Footprint for Fiscal Year 2016 Fraunhofer IZM reviewed Apple’s scope 3 company carbon footprint (CCF) data related to the products manufactured and sold by Apple Inc. in fiscal year 2016. 1 Summary This review checks transparency of data and calculations, appropriateness of supporting product related data and assumptions, and overall plausibility of the calculated corporate annual carbon footprint comprised of emissions derived from the life cycle assessment (LCA) of Apple products shipped in fiscal year 2016. This review and verification focuses on Scope 3 emissions for products sold by Apple Inc. (as defined by WRI/WBCSD/Greenhouse Gas Protocol – Scope 3 Accounting and Reporting Standard). It is noted that emissions relating to the facilities that are owned or leased by Apple (scope 1 and 2 emissions) as well as business travel and employee commute were subject to a separate third party verification and are therefore excluded from the scope of this statement. Confidential data relating to product sales and shipments were also excluded from the scope of this verification. This review and verification covers Apple’s corporate annual greenhouse gas emissions and does not replace reviews conducted for individual product LCAs for greenhouse gas emissions (GHGs). The life cycle emissions data produced by Apple for individual products has been calculated in accordance to the standard ISO 14040/14044: Environmental management – Life cycle assessment – Principles and framework / Requirements and guidelines. This review and verification furthermore complies with ISO 14064-3: Greenhouse gases — Part 3: Specification with guidance for the validation and verification of greenhouse gas assertions. The review of the corporate annual carbon footprint has considered the following criteria: The system, boundaries and functional unit are clearly defined Assumptions and estimations made are appropriate Selection of primary and secondary data is appropriate and methodologies used are adequately disclosed 51 CCF Letter of Assurance Client: Apple Inc. 2 These criteria are also fundamental to the review of LCAs conducted for individual product emissions. The reviewers note that the largest share (99%) of Apple Inc. annual corporate carbon footprint is comprised of scope 3 emissions from individual products. The aforementioned criteria have been regularly reviewed by Fraunhofer IZM since 2007 with a view to providing independent feedback that can facilitate continuous improvement and refinement in the LCA methodology applied by Apple Inc. Data reported by Apple is as follows: Manufacturing Transportation Product Use Recycling 2016 22.77 1.20 4.86 0.30 [MMT CO2e] [MMT CO2e] [MMT CO2e] [MMT CO2e] MMT CO2e: million metric tons carbon dioxide equivalents Including a reported value of 0.38 million metric tons CO2e for facilities (out of scope of this verification), total CCF is reported to be 29.52 million metric tons CO2e. Apple’s CCF includes greenhouse gas emissions reductions for manufacturing resulting from Apple renewable energy projects, supplier renewable electricity purchases, and supplier renewable electricity installations. Many of these reductions are part of Apple’s Clean Energy Program. Fraunhofer IZM has not verified these emissions reductions. Based on the process and procedures conducted, there is no evidence that the Greenhouse Gas (GHG) assertion with regards to scope 3 corporate carbon footprint is not materially correct and is not a fair representation of GHG data and information, and has not been prepared in accordance with the related International Standard on GHG quantification, monitoring and reporting. 2 Reviewed Data and Plausibility Check A verification and sampling plan as required by ISO 14046-3 has been established in the course of this CCF review and verification, defining the level of assurance, objectives, criteria, scope and materiality of the verification. As part of this review and verification Apple disclosed following data to Fraunhofer IZM: Sales data for FY2016, including accessories and including AppleCare, Apple’s extended warranty and technical support plans for their devices. 52 CCF Letter of Assurance Client: Apple Inc. 3 Regional distribution of sold units and country specific allocation per product to major sell-in countries Product specific data on transportation including breakdown of air and sea shipment Life cycle GHG emissions for all products, differentiating the actual product configurations (i.e. memory capacity) Calculation methodology for the company carbon footprint and methodological changes implemented in 2016 The total company carbon footprint – scope 3 for the fiscal year 2016 Detailed analysis of the CCF including: o The breakdown of the CCF into life cycle phases manufacturing, transportation, product use and recycling o Detailed product specific split into life cycle phases o The contribution of individual products and product families to the overall CCF The data and information supporting the GHG assertion were projected (use phase and recycling) and historical (i.e. fiscal year 2016 data regarding sales figures, manufacturing, transportation). This review comprises a check of selected data, which are most influential to the overall company carbon footprint. The overall plausibility check addressed the following questions: Are product LCAs referenced correctly? Are results for products, for which no full LCA review was undertaken, plausible? Are carbon emission data for individual products plausible in the light of methodological changes as indicated by Apple? This review was done remotely. 3 Findings Prior to this CCF review and verification 5 recent product LCA studies have been reviewed successfully against ISO 14040/44. These recent LCAs cover product segments Apple 53 CCF Letter of Assurance Client: Apple Inc. 4 Watch, iPad, and iPhone. These latest LCA studies cover products which represent in total 7,2% of the total scope 3 company carbon footprint. Representatives of other product segments (iPod, MacBook, MacBook Pro, iMac, Mac Pro, Mac Mini, Airport Express / Airport Extreme, Apple TV, and Beats products) underwent no or only minor design changes compared to those which went through a full LCA review in former years. All reviewed LCA studies up to now cover in total 55,6% of the total scope 3 company carbon footprint. The methodological changes implemented with the 2016 CCF data are confirmed to lead to an improvement in terms of accuracy and real use patterns representation of the results. Inevitably this hampers the comparability of published 2016 results with earlier CCF data. All questions raised in the course of the review were answered by Apple and related evidence was provided where needed. Further improvements of applied data models have been discussed with Apple and are under consideration for future methodological revisions. 4 Conclusions We observe from year to year an improvement of the assessment approach in terms of granularity of the used calculation data. This year several additional components are modelled with more accurate primary data from Apple’s suppliers and with updated calculation models. For all product LCA calculations, where exact data was missing, the principle of a worstcase approach has been followed and results have been calculated with rather conservative estimates. The review has not found assumptions or calculation errors on the CCF data level that indicate the scope 3 corporate carbon footprint has been materially misstated. The excellent analysis meets the principles of good scientific practice. Berlin, March 31, 2017 – Karsten Schischke – – Christian Clemm – Fraunhofer IZM Fraunhofer IZM Dept. Environmental and Dept. Environmental and Reliability Engineering Reliability Engineering 54 Corporate Fiber Footprint Review Client: Apple Inc. 1 Review Statement Corporate Fiber Footprint Fraunhofer IZM reviewed Apple’s corporate fiber footprint data related to corporate fiber usage from products, corporate, and retail operations in fiscal year 2016. 1 Summary This review checks transparency of data and calculations, appropriateness of supporting product and packaging related data and assumptions, and overall plausibility of the calculated corporate annual fiber footprint of Apple products shipped in fiscal year 2016 and of corporate and retail operations in the same period. As there is no standardised method available for calculating a product or company fiber footprint Apple defined a methodology for internal use. The scope of the Fiber Footprint includes Apple’s corporate fiber usage from products, corporate, and retail operations. The fiber footprint tracks the total amount of wood fiber, both virgin and recycled, that Apple uses in packaging, and other paper products. Apple obtains and analyses supplier-specific data for each product line and sums up these figures for the entire company using sell-in numbers. The output is a total fiber footprint. The review of the corporate annual fiber footprint has considered the following criteria: The system boundaries are clearly defined Assumptions and estimations made are appropriate Use of supplier data is appropriate and methodologies used are adequately disclosed Data reported by Apple is as follows: Total Fiber Virgin Fiber Recycled Fiber 2016 131,151 50,210 80,941 [metric tons fiber] [metric tons fiber] [metric tons fiber] All results and figures reviewed for fiscal year 2016 are plausible. 55 Corporate Fiber Footprint Review Client: Apple Inc. 2 2 Reviewed Data and Findings As part of this review Apple disclosed following data to Fraunhofer IZM: Calculation methodology for the corporate fiber footprint Sales data for FY2016, including accessories Selected product and supplier specific data on packaging design (including CAD design drawings), materials (distinction of paper qualities, fiber content, including recycled fiber content), weights and production yields (process yields and cut-off losses) Aggregated fiber data for all products and the total corporate fiber footprint for the fiscal year 2016 The revised methodology paper provided by Apple (Fiber Footprint at Apple – Methodology Description – V1.1) on March 6, 2017, is considered a sound and appropriate guidance for determining the company fiber footprint. Where appropriate, this approach follows methodological principles applied for state-of-the-art Life Cycle Assessments. This review comprises a check of fiber data for selected products, which are most influential to the overall corporate fiber footprint and which represent the full spectrum of Apple products. The selection of products for individual reviews has been agreed between Apple and Fraunhofer IZM. Plausibility of some data has been questioned and discussed with Apple in detail. Corrections were made accordingly. Similarly, system boundaries for the corporate and retail related fiber usage have been discussed and clarified. This review was done remotely. All questions raised in the course of the review were answered by Apple and related evidence was provided where needed. Based on the process and procedures conducted, there is no evidence that the corporate fiber footprint is not materially correct and is not a fair representation of fiber data and information. The excellent analysis meets the principles of good scientific practice. Berlin, March 8, 2017 – Karsten Schischke – – Dr. Nils F. Nissen – Fraunhofer IZM Fraunhofer IZM Dept. Environmental and Dept. Environmental and Reliability Engineering Reliability Engineering 56 Environmental Responsibility Report | 2017 Progress Report, Covering FY2016 57 Appendix D Environmental Health and Safety Policy Statement Mission statement Apple Inc. is committed to protecting the environment, health, and safety of our employees, customers and the global communities where we operate. We recognize that by integrating sound environmental, health, and safety management practices into all aspects of our business, we can offer technologically innovative products and services while conserving and enhancing resources for future generations. Apple strives for continuous improvement in our environmental, health and safety management systems and in the environmental quality of our products, processes, and services. Guiding principles Meet or exceed all applicable environmental, health and safety requirements. We will evaluate our EHS performance by monitoring ongoing performance results and through periodic management reviews. Where laws and regulations do not provide adequate controls, we will adopt our own standards to protect human health and the environment. Support and promote sound scientific principles and fiscally responsible public policy that enhance environmental quality, health and safety. Advocate the adoption of prudent environmental, health and safety principles and practices by our contractors, vendors, and suppliers. Communicate environmental, health, and safety policies and programs to Apple employees and stakeholders. Design, manage and operate our facilities to maximize safety, promote energy efficiency, and protect the environment. Strive to create products that are safe in their intended use, conserve energy and materials, and prevent pollution throughout the product life cycle including design, manufacture, use, and end-of-life management. Ensure that all employees are aware of their role and responsibility to fulfill and sustain Apple’s environmental, health and safety management systems and policy. Luca Maestri Senior Vice President and CFO January 2017 Report Notes: • This report is published annually and covers fiscal year 2016 activities, unless otherwise noted. • This report addresses environmental impacts and activities at Apple-owned facilities (corporate offices, data centers, and retail stores), as well as the life-cycle impacts of our products, including in the manufacturing, transportation, use, and end-of-life phases. • To provide feedback on this report, please contact environment-report@apple.com. ¹ “Boards and Flexes” refers to printed circuit boards and flexible printed circuits. ² CO₂e, or carbon dioxide equivalent, is a standard unit for measuring carbon footprints. It translates into one number the impact of different greenhouse gases based on their potential to contribute to climate change. ³ Greenhouse gas equivalencies calculated using the U.S. EPA Greenhouse Gas Equivalencies Calculator: www.epa.gov/energy/greenhouse-gas-equivalencies-calculator. ⁴ Based on sales-weighted averages. ⁵ Based on the average residential cost of electricity in the U.S. in 2015; includes customer use scenarios and power consumed by the power adapter when disconnected from the iPhone. ⁶ Based on the EPA ENERGY STAR database for Desktop Computers as of February 7, 2017. ⁷ The tin in the solder has been verified by a third party to be 100 percent recycled. As of April 2017, we’re transitioning iPhone 6s production to use 100 percent recycled tin solder for the main logic board. ⁸ Based on expected equivalent fiber production from our forestry projects and virgin fiber used for Apple product packaging. To determine the output of Apple’s projects, we work with our partners to understand the productive potential of these working forests. The forest management plans required to achieve or maintain certification limit harvest volumes to sustainable levels. We use these potential harvest volumes to estimate the sustainable productive capacity of these forests. ⁹ Anhui, Fujian, Guangxi, Guangdong, Hubei, Hunan, and Yunnan provinces. ¹⁰Every Apple product is free of PVC and phthalates with the exception of power cords in India and South Korea, where we continue to seek government approval for our PVC and phthalates replacement. © 2017 Apple Inc. All rights reserved. Apple, the Apple logo, AirPort Express, AirPort Extreme, Apple Pencil, Apple TV, Apple Watch, FaceTime, iBooks, iMac, iMessage, iPad, iPad Pro, iPhone, iPod, iTunes, Mac, Mac Pro, MacBook, MacBook Pro, Mac mini, macOS, and Siri are trademarks of Apple Inc., registered in the U.S. and other countries. Touch Bar is a trademark of Apple Inc. App Store, AppleCare, and Apple Store are service marks of Apple Inc., registered in the U.S. and other countries. ENERGY STAR is a U.S. registered mark. Other product and company names mentioned herein may be trademarks of their respective companies. April 2017